
Nebraska's Total Energy Consumption by Fuel Type
Nebraska's total energy consumption in 2022 was 846 British thermal units (Btu), which was a 0.4 percent increase from 2021. Total energy consumption is consumption of primary resources and end–use energy. According to the Energy Consumption Comparison by State report, Nebraska had the 34th highest (18th lowest) energy consumption in the country, which was less than one percent (0.9 percent) of the nation's total consumption. Using energy consumption per capita for comparison, Nebraska was the 9th highest in the country.
Primary resource consumption includes energy used in the generation of electricity whether that electricity is used in Nebraska or not. In 2022, consumption of primary energy resources was 886 trillion Btu, which was a 1.4–percent increase from 2021. The first table under the graphs provides primary resources' consumption.
End–use energy consumption refers to the energy content of electricity and other fuels at the point of use by consumers. Unless otherwise noted, total energy consumption refers to total primary energy consumption adjusted for net interstate sales of electricity. Net interstate sales represent the difference between the energy in electricity sold, including the associated losses, and the energy input at electric utilities in Nebraska. Net interstate sales will be a negative number if Nebraska sold, or exported, electricity; and net interstate sales will be a positive number if Nebraska had to buy, or import, electricity. A percentage of the primary energy used to generate and distribute electricity is lost as waste heat. This loss is referred to as associated energy losses, electric system losses, or net interstate flows and losses of electricity.
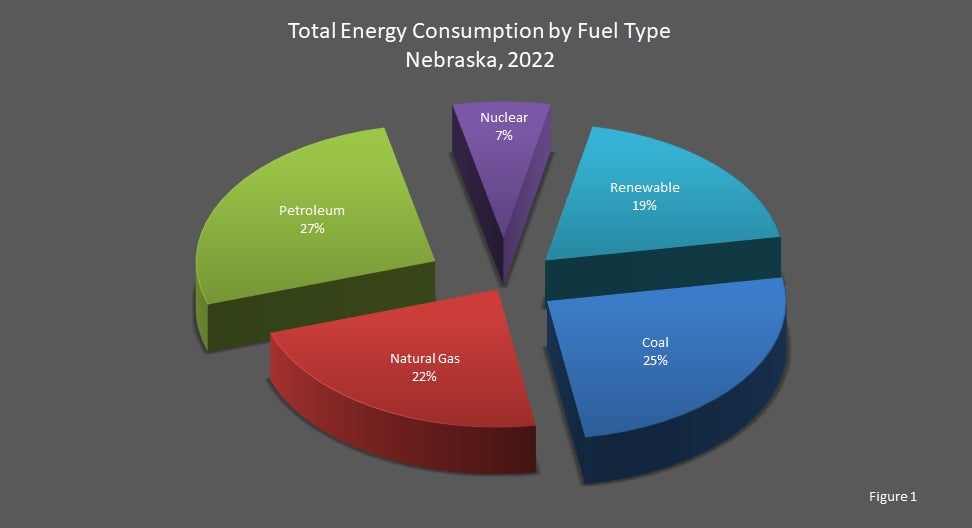
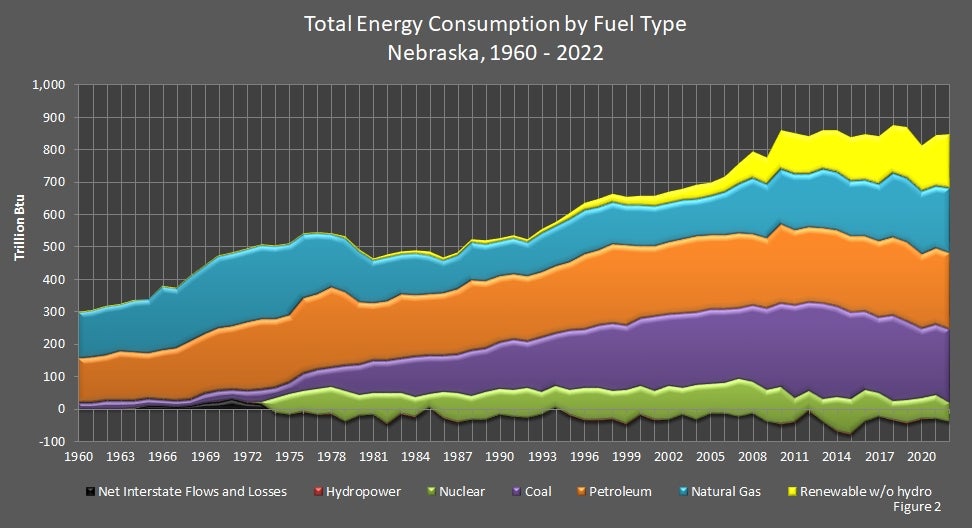
In 2022, Nebraska's energy needs were met by petroleum (27 percent), coal (25 percent), natural gas (22 percent), renewable energy (19 percent), and nuclear electric power (7 percent). See Figure 1 just below. In Figure 2 farther below, hydroelectric power is broken out of renewable energy. (To see a pie chart of electricity generation fuels, go to the Annual Electricity Generation by Fuel Type report.)
From 2021 to 2022, renewable energy use increased 6.6 percent, natural gas use increased 4.0 percent, and coal use increased 3.4 percent. Nuclear electric power use decreased 18.3 percent, and petroleum use decreased 0.14 percent.
Petroleum products are listed in the second table below. Petroleum is divided into ten fuels or categories of fuels: distillate fuel (48 percent of petroleum), motor gasoline (42 percent), propane (4 percent), jet fuel (2 percent), asphalt and road oil (2 percent), other petroleum (1.03 percent), lubricants (0.88 percent), aviation gasoline (0.08 percent), residual fuel (0.01 percent), and kerosene (0.004 percent).
Other petroleum products include sixteen (16) separate products, all of which are assigned to the industrial sector. The sixteen products are:
- aviation gasoline blending components;
- crude oil;
- motor gasoline blending components;
- natural gasoline, including isopentane;
- pentanes plus;
- petrochemical feedstocks, naphtha;
- petrochemical feedstocks, other oils;
- petrochemical feedstocks, still gas;
- petroleum coke;
- plant condensate;
- special naphthas;
- still gas;
- unfinished oils;
- unfractionated streams;
- waxes; and
- miscellaneous.
- Miscellaneous products vary from inexpensive (absorption oils similar to kerosene) to very expensive (hydraulic fluids) products. The greater part of the miscellaneous product line consists of finished petrochemicals, especially the aromatic hydrocarbons: benzene, toluene, and the xylenes.
Renewable energy components are listed in the third table below. Renewable energy consists of biofuels (68.91 percent of renewable energy), wind (25.52 percent of renewable energy), wood and waste (2.47 percent of renewable energy), conventional hydroelectric power (2.14 percent of renewable energy), geothermal (0.72 percent of renewable energy), and photovoltaic and solar thermal energy (0.24 percent of renewable energy). Note that Nebraska did use wind energy in 1998, 1999, and 2000 although the numbers were not large enough until 2001 to be included in the table below. Also see Nebraska's renewable energy consumption report.
Energy Consumption by Fuel Type, Nebraska, 1960 – 2022
[Trillion British Thermal Units (Btu)]
| Year | Primary Energy Resources | Total Primary Energy Consumption | Net Interstate Flow of Electricity / Losses | Total Energy Consumption | ||||
|---|---|---|---|---|---|---|---|---|
| Fossil Fuels | Nuclear Electric Power | Renewable Energy | ||||||
| Coal | Natural Gas | Petroleum | ||||||
| 2022 | 223.57 | 198.67 | 236.25 | 58.60 | 168.64 | 885.72 | –39.33 | 846.39 |
| 2021 | 216.30 | 191.01 | 236.57 | 71.76 | 158.26 | 873.89 | –30.58 | 843.31 |
| 2020 | 213.75 | 192.73 | 228.35 | 64.65 | 145.73 | 845.19 | –32.73 | 812.46 |
| 2019 | 240.41 | 198.77 | 242.93 | 72.59 | 156.69 | 911.40 | –45.65 | 865.74 |
| 2018 | 264.07 | 196.45 | 239.32 | 58.88 | 150.87 | 909.47 | –36.08 | 873.39 |
| 2017 | 233.81 | 175.61 | 233.52 | 72.30 | 148.75 | 864.01 | –26.09 | 837.92 |
| 2016 | 240.47 | 172.93 | 232.84 | 97.80 | 141.42 | 885.46 | –39.25 | 846.21 |
| 2015 | 266.32 | 170.35 | 234.27 | 107.98 | 135.82 | 914.73 | –79.83 | 834.90 |
| 2014 | 276.54 | 179.71 | 234.47 | 105.66 | 132.15 | 928.52 | –69.61 | 858.91 |
| 2013 | 292.96 | 179.62 | 231.61 | 71.74 | 120.48 | 896.40 | –40.24 | 856.16 |
| 2012 | 272.59 | 161.77 | 233.03 | 60.80 | 117.46 | 845.65 | –7.89 | 837.76 |
| 2011 | 285.38 | 173.66 | 231.43 | 72.55 | 127.73 | 890.74 | –42.18 | 848.56 |
| 2010 | 254.55 | 169.61 | 243.23 | 115.54 | 122.68 | 905.61 | –47.76 | 857.85 |
| 2009 | 249.59 | 165.42 | 216.10 | 98.68 | 81.78 | 811.58 | –37.35 | 774.23 |
| 2008 | 234.65 | 172.86 | 219.57 | 99.08 | 81.20 | 807.36 | –14.75 | 792.61 |
| 2007 | 216.87 | 153.49 | 229.20 | 115.82 | 60.57 | 775.97 | –21.55 | 754.42 |
| 2006 | 227.44 | 131.42 | 228.78 | 93.94 | 47.75 | 729.33 | –15.02 | 714.31 |
| 2005 | 228.67 | 120.13 | 228.76 | 91.86 | 45.34 | 714.73 | –15.97 | 698.76 |
| 2004 | 223.62 | 116.01 | 233.55 | 106.80 | 45.86 | 725.83 | –33.84 | 691.99 |
| 2003 | 227.29 | 119.74 | 229.10 | 83.34 | 38.72 | 698.20 | –18.92 | 679.29 |
| 2002 | 217.94 | 121.17 | 222.23 | 105.70 | 36.75 | 703.79 | –34.53 | 669.26 |
| 2001 | 226.69 | 124.05 | 215.47 | 91.13 | 35.62 | 692.95 | –35.49 | 657.47 |
| 2000 | 206.94 | 127.26 | 221.60 | 89.99 | 33.50 | 679.29 | –20.78 | 658.51 |
| 1999 | 198.49 | 121.36 | 246.04 | 105.45 | 32.90 | 704.10 | –49.35 | 654.75 |
| 1998 | 204.80 | 131.11 | 243.77 | 86.64 | 31.25 | 697.41 | –32.87 | 664.54 |
| 1997 | 193.33 | 132.01 | 230.49 | 97.27 | 30.56 | 683.66 | –35.63 | 648.03 |
| 1996 | 178.88 | 133.53 | 232.22 | 99.33 | 27.33 | 671.28 | –36.44 | 634.83 |
| 1995 | 179.48 | 133.68 | 209.70 | 78.65 | 23.54 | 625.05 | –20.48 | 604.57 |
| 1994 | 160.51 | 123.98 | 206.55 | 66.32 | 15.66 | 573.02 | 3.18 | 576.20 |
| 1993 | 166.21 | 122.21 | 199.08 | 71.48 | 13.95 | 572.93 | –18.98 | 553.95 |
| 1992 | 140.93 | 103.22 | 203.32 | 91.61 | 13.69 | 552.76 | –27.73 | 525.03 |
| 1991 | 152.01 | 111.96 | 200.52 | 84.37 | 12.10 | 560.96 | –24.69 | 536.26 |
| 1990 | 142.02 | 106.85 | 205.03 | 79.49 | 11.74 | 545.12 | –18.63 | 526.49 |
| 1989 | 131.10 | 116.61 | 206.71 | 85.48 | 13.94 | 553.83 | –33.26 | 520.58 |
| 1988 | 139.34 | 117.99 | 215.76 | 72.39 | 13.63 | 559.12 | –34.80 | 524.32 |
| 1987 | 116.46 | 105.57 | 200.56 | 89.68 | 13.85 | 526.12 | –42.42 | 483.70 |
| 1986 | 109.94 | 101.87 | 191.72 | 81.01 | 14.84 | 499.38 | –31.08 | 468.30 |
| 1985 | 115.48 | 121.22 | 189.26 | 43.91 | 14.50 | 484.37 | 1.70 | 486.08 |
| 1984 | 124.26 | 129.49 | 187.41 | 62.68 | 13.40 | 517.24 | –26.63 | 490.60 |
| 1983 | 104.82 | 124.99 | 195.55 | 66.32 | 11.95 | 503.63 | –17.63 | 486.00 |
| 1982 | 96.75 | 135.55 | 184.67 | 96.92 | 11.20 | 525.09 | –47.91 | 477.18 |
| 1981 | 98.58 | 133.48 | 176.32 | 66.05 | 9.69 | 484.11 | –18.76 | 465.35 |
| 1980 | 93.94 | 159.48 | 189.49 | 63.08 | 10.46 | 516.46 | –22.29 | 494.17 |
| 1979 | 77.60 | 168.96 | 224.65 | 94.20 | 8.18 | 573.59 | –41.19 | 532.40 |
| 1978 | 59.81 | 162.69 | 246.42 | 84.52 | 7.85 | 561.29 | –17.45 | 543.85 |
| 1977 | 59.34 | 188.43 | 231.19 | 80.25 | 7.56 | 566.78 | –19.95 | 546.83 |
| 1976 | 53.71 | 197.44 | 229.55 | 64.34 | 7.49 | 552.53 | –10.76 | 541.77 |
| 1975 | 32.89 | 217.52 | 208.27 | 65.15 | 6.91 | 530.74 | –19.15 | 511.59 |
| 1974 | 32.76 | 223.25 | 210.07 | 44.60 | 7.07 | 517.75 | –12.94 | 504.81 |
| 1973 | 36.87 | 230.78 | 214.16 | 6.54 | 7.35 | 495.69 | 14.46 | 510.15 |
| 1972 | 33.51 | 226.36 | 211.47 | 0.00 | 7.26 | 478.60 | 19.01 | 497.61 |
| 1971 | 26.32 | 225.46 | 195.49 | 0.00 | 6.24 | 453.51 | 29.45 | 482.96 |
| 1970 | 29.72 | 224.11 | 192.24 | 0.00 | 6.24 | 452.32 | 22.82 | 475.14 |
| 1969 | 27.08 | 209.61 | 182.78 | 0.00 | 5.83 | 425.30 | 18.61 | 443.92 |
| 1968 | 17.19 | 202.94 | 177.86 | 0.00 | 5.95 | 403.95 | 9.22 | 413.16 |
| 1967 | 18.30 | 187.91 | 158.85 | 0.00 | 5.71 | 370.77 | 5.79 | 376.56 |
| 1966 | 19.75 | 195.86 | 151.34 | 0.00 | 5.81 | 372.77 | 8.32 | 381.09 |
| 1965 | 20.82 | 164.72 | 140.54 | –0.06 | 5.71 | 331.72 | 8.26 | 339.98 |
| 1964 | 23.65 | 160.55 | 147.14 | 1.08 | 5.73 | 338.15 | 1.15 | 339.29 |
| 1963 | 24.51 | 145.77 | 151.18 | 0.89 | 6.03 | 328.38 | –0.77 | 327.61 |
| 1962 | 23.05 | 149.32 | 141.45 | 0.00 | 6.00 | 319.82 | 0.17 | 319.98 |
| 1961 | 18.16 | 144.57 | 138.37 | 0.00 | 6.11 | 307.22 | 0.96 | 308.18 |
| 1960 | 20.01 | 140.43 | 136.00 | 0.00 | 6.38 | 302.82 | –1.32 | 301.50 |
Petroleum Products Consumption, Nebraska, 1960 – 2022
[Trillion British Thermal Units (Btu)]
| Year | Primary Energy Resources | |||||||||
|---|---|---|---|---|---|---|---|---|---|---|
| Petroleum | ||||||||||
| Asphalt and Road Oil | Aviation Gasoline | Distillate Fuel | Jet Fuel | Kerosene | Lubricants | Motor Gasoline | Other Petroleum 1 | Propane | Residual Fuel | |
| 2022 | 6.01 | 0.18 | 112.59 | 6.12 | 0.01 | 2.07 | 99.97 | 2.44 | 9.77 | 0.03 |
| 2021 | 6.18 | 0.18 | 113.69 | 6.06 | 0.01 | 1.76 | 100.37 | 2.34 | 9.89 | 0.02 |
| 2020 | 6.25 | 0.18 | 113.56 | 4.92 | 0.01 | 1.65 | 93.77 | 0.88 | 10.34 | 0.02 |
| 2019 | 5.12 | 0.19 | 117.75 | 6.57 | 0.01 | 1.76 | 102.44 | 0.94 | 11.34 | 0.02 |
| 2018 | 5.70 | 0.19 | 114.83 | 4.54 | 0.01 | 1.78 | 102.39 | 1.03 | 9.86 | 0.04 |
| 2017 | 6.47 | 0.20 | 111.37 | 7.92 | 0.01 | 1.80 | 101.60 | 0.64 | 8.19 | 0.01 |
| 2016 | 5.80 | 0.18 | 111.20 | 7.52 | 0.01 | 1.96 | 102.15 | 0.63 | 8.88 | 0.00 |
| 2015 | 6.33 | 0.17 | 111.75 | 6.48 | 0.01 | 2.03 | 99.98 | 0.63 | 9.52 | 0.00 |
| 2014 | 6.17 | 0.19 | 110.52 | 6.12 | 0.01 | 1.87 | 100.62 | 0.62 | 11.27 | 0.01 |
| 2013 | 6.12 | 0.17 | 110.02 | 6.07 | 0.01 | 1.79 | 97.10 | 0.60 | 12.46 | 0.00 |
| 2012 | 7.56 | 0.22 | 114.45 | 5.11 | 0.01 | 1.69 | 94.69 | 0.21 | 9.95 | 0.01 |
| 2011 | 6.75 | 0.23 | 112.51 | 4.68 | 0.01 | 1.84 | 94.35 | 0.21 | 11.32 | 0.01 |
| 2010 | 7.57 | 0.25 | 117.56 | 4.68 | 0.03 | 1.94 | 97.81 | 0.22 | 12.41 | 0.01 |
| 2009 | 7.27 | 0.32 | 93.30 | 3.95 | 0.04 | 1.74 | 96.70 | 0.19 | 13.77 | 0.05 |
| 2008 | 5.38 | 0.33 | 94.64 | 5.04 | 0.02 | 1.94 | 98.86 | 0.22 | 13.14 | 0.51 |
| 2007 | 6.00 | 0.40 | 99.73 | 5.49 | 0.05 | 2.09 | 102.15 | 0.22 | 13.09 | 0.44 |
| 2006 | 6.99 | 0.41 | 95.95 | 6.01 | 0.05 | 2.02 | 103.18 | 0.25 | 13.82 | 0.49 |
| 2005 | 8.07 | 0.42 | 94.83 | 5.30 | 0.10 | 2.08 | 103.22 | 0.20 | 13.96 | 0.91 |
| 2004 | 8.64 | 0.28 | 95.62 | 5.21 | 0.12 | 2.09 | 105.40 | 0.20 | 14.89 | 1.45 |
| 2003 | 8.87 | 0.41 | 89.65 | 6.83 | 0.09 | 2.06 | 104.41 | 0.21 | 16.03 | 0.89 |
| 2002 | 5.33 | 0.47 | 81.09 | 8.66 | 0.04 | 2.23 | 105.74 | 0.22 | 18.21 | 0.78 |
| 2001 | 5.68 | 0.44 | 82.67 | 6.31 | 0.12 | 2.26 | 104.03 | 0.23 | 13.38 | 0.80 |
| 2000 | 6.22 | 0.32 | 86.92 | 6.98 | 0.09 | 2.46 | 103.91 | 0.11 | 14.17 | 0.90 |
| 1999 | 12.39 | 0.36 | 103.31 | 8.87 | 0.06 | 2.50 | 104.76 | 0.12 | 13.60 | 0.48 |
| 1998 | 9.29 | 0.32 | 108.50 | 6.13 | 0.13 | 2.47 | 104.14 | 0.14 | 12.29 | 0.73 |
| 1997 | 9.62 | 0.45 | 98.06 | 6.10 | 0.13 | 2.36 | 101.73 | 0.14 | 11.57 | 0.69 |
| 1996 | 11.76 | 0.38 | 96.87 | 5.71 | 0.11 | 2.24 | 100.16 | 0.16 | 14.14 | 1.05 |
| 1995 | 6.16 | 0.39 | 84.97 | 5.67 | 0.10 | 2.31 | 98.47 | 0.17 | 11.16 | 0.76 |
| 1994 | 6.84 | 0.38 | 84.94 | 7.03 | 0.12 | 2.35 | 92.50 | 0.17 | 11.38 | 1.33 |
| 1993 | 5.29 | 0.36 | 80.66 | 6.42 | 0.14 | 2.24 | 91.53 | 0.17 | 10.99 | 1.73 |
| 1992 | 5.96 | 0.41 | 80.66 | 6.62 | 0.11 | 2.20 | 94.30 | 0.16 | 11.92 | 1.16 |
| 1991 | 9.41 | 0.43 | 75.43 | 6.60 | 0.10 | 2.16 | 93.51 | 0.15 | 11.68 | 1.25 |
| 1990 | 9.21 | 0.42 | 74.84 | 8.29 | 0.23 | 2.42 | 96.92 | 0.56 | 10.71 | 1.61 |
| 1989 | 7.50 | 0.47 | 75.11 | 8.16 | 0.12 | 2.35 | 96.80 | 0.58 | 13.48 | 2.35 |
| 1988 | 8.38 | 0.48 | 82.26 | 8.25 | 0.43 | 2.29 | 97.75 | 0.59 | 12.95 | 2.59 |
| 1987 | 8.24 | 0.45 | 73.43 | 7.51 | 0.59 | 2.37 | 93.95 | 0.55 | 11.96 | 1.67 |
| 1986 | 6.33 | 0.59 | 70.04 | 7.40 | 0.95 | 2.10 | 93.28 | 0.52 | 9.06 | 1.58 |
| 1985 | 3.14 | 0.49 | 72.29 | 7.42 | 0.42 | 2.15 | 93.17 | 0.42 | 9.54 | 0.39 |
| 1984 | 4.19 | 0.54 | 69.92 | 7.59 | 0.50 | 2.30 | 93.88 | 0.41 | 7.79 | 0.44 |
| 1983 | 4.43 | 0.60 | 67.26 | 8.14 | 0.43 | 2.16 | 94.06 | 0.41 | 17.73 | 0.66 |
| 1982 | 4.89 | 0.62 | 53.90 | 7.95 | 0.53 | 2.06 | 95.93 | 0.38 | 17.57 | 1.20 |
| 1981 | 4.45 | 1.08 | 47.77 | 8.01 | 0.49 | 2.26 | 96.30 | 0.88 | 14.88 | 0.44 |
| 1980 | 4.77 | 1.08 | 53.29 | 8.69 | 0.35 | 2.36 | 100.33 | 0.76 | 16.72 | 1.43 |
| 1979 | 5.42 | 0.91 | 74.92 | 10.50 | 0.32 | 2.65 | 107.57 | 0.78 | 17.41 | 4.44 |
| 1978 | 10.66 | 1.04 | 73.57 | 10.99 | 2.59 | 2.53 | 115.96 | 0.85 | 20.50 | 7.96 |
| 1977 | 7.29 | 0.93 | 63.59 | 9.76 | 3.17 | 2.36 | 114.57 | 0.86 | 22.13 | 6.84 |
| 1976 | 3.79 | 0.70 | 60.73 | 9.33 | 3.60 | 3.32 | 113.36 | 0.90 | 24.63 | 9.46 |
| 1975 | 5.00 | 0.71 | 49.56 | 9.24 | 3.14 | 2.98 | 108.40 | 0.88 | 21.67 | 6.87 |
| 1974 | 6.47 | 0.88 | 51.54 | 9.89 | 3.53 | 3.15 | 107.23 | 0.88 | 20.05 | 6.60 |
| 1973 | 5.87 | 0.87 | 54.21 | 9.15 | 4.43 | 3.29 | 110.04 | 0.91 | 21.28 | 4.21 |
| 1972 | 5.90 | 0.45 | 52.99 | 9.44 | 4.37 | 2.89 | 107.23 | 0.85 | 22.90 | 4.53 |
| 1971 | 7.37 | 1.00 | 44.34 | 9.93 | 3.86 | 2.70 | 101.02 | 0.81 | 20.88 | 3.64 |
| 1970 | 7.55 | 1.00 | 43.39 | 9.77 | 3.30 | 2.91 | 97.31 | 0.62 | 21.46 | 4.99 |
| 1969 | 4.92 | 1.18 | 37.51 | 11.16 | 2.98 | 2.85 | 94.99 | 0.66 | 21.70 | 4.90 |
| 1968 | 5.23 | 2.81 | 37.60 | 11.58 | 3.62 | 2.83 | 91.67 | 0.48 | 18.03 | 4.04 |
| 1967 | 4.02 | 1.68 | 30.13 | 10.07 | 1.97 | 2.58 | 88.06 | 0.32 | 16.35 | 3.69 |
| 1966 | 4.74 | 1.83 | 26.00 | 8.19 | 4.10 | 2.68 | 86.21 | 0.26 | 14.81 | 2.70 |
| 1965 | 4.35 | 2.07 | 21.49 | 7.41 | 4.48 | 2.58 | 82.71 | 0.30 | 13.17 | 2.09 |
| 1964 | 4.34 | 2.24 | 27.14 | 8.24 | 2.81 | 2.43 | 81.01 | 0.27 | 12.61 | 6.18 |
| 1963 | 5.60 | 2.16 | 25.34 | 8.03 | 2.59 | 2.31 | 83.49 | 0.28 | 14.24 | 7.30 |
| 1962 | 4.68 | 2.13 | 23.77 | 7.88 | 3.46 | 2.32 | 81.35 | 0.28 | 11.43 | 4.18 |
| 1961 | 4.66 | 2.10 | 25.99 | 7.04 | 3.53 | 2.51 | 78.61 | 0.27 | 10.59 | 3.12 |
| 1960 | 5.18 | 1.87 | 24.18 | 6.44 | 3.84 | 2.58 | 78.79 | 0.28 | 10.31 | 2.61 |
Renewable Energy Consumption, Nebraska, 1960 – 2022
[Trillion British Thermal Units (Btu)]
| Year | Primary Energy Resources | |||||
|---|---|---|---|---|---|---|
| Renewable Energy | ||||||
| Geothermal | Hydroelectric Power | Photovoltaic and Solar Thermal | Wind | Biomass | ||
| Biofuels | Wood and Waste | |||||
| 2022 | 1.21 | 3.61 | 0.40 | 43.04 | 116.21 | 4.16 |
| 2021 | 1.21 | 3.83 | 0.32 | 32.73 | 115.82 | 4.35 |
| 2020 | 1.21 | 4.74 | 0.28 | 31.10 | 104.15 | 4.24 |
| 2019 | 1.21 | 4.57 | 0.19 | 24.60 | 120.62 | 5.49 |
| 2018 | 1.21 | 4.72 | 0.16 | 18.93 | 120.65 | 5.21 |
| 2017 | 1.21 | 5.08 | 0.10 | 17.35 | 121.10 | 3.92 |
| 2016 | 1.21 | 2.92 | 0.05 | 12.96 | 119.77 | 4.50 |
| 2015 | 1.21 | 5.75 | 0.03 | 10.85 | 113.81 | 4.16 |
| 2014 | 1.21 | 3.95 | 0.03 | 9.34 | 112.99 | 4.63 |
| 2013 | 1.21 | 3.84 | 0.03 | 6.15 | 104.69 | 4.57 |
| 2012 | 1.21 | 4.29 | 0.03 | 4.38 | 103.82 | 3.74 |
| 2011 | 1.20 | 5.52 | 0.03 | 3.59 | 113.14 | 4.26 |
| 2010 | 1.15 | 4.48 | 0.03 | 1.44 | 107.32 | 8.27 |
| 2009 | 1.02 | 1.48 | 0.03 | 1.31 | 70.16 | 7.79 |
| 2008 | 0.88 | 1.18 | 0.03 | 0.73 | 71.03 | 7.36 |
| 2007 | 0.80 | 1.19 | 0.02 | 0.74 | 50.68 | 7.14 |
| 2006 | 0.73 | 3.05 | 0.02 | 0.89 | 36.69 | 6.37 |
| 2005 | 0.67 | 2.97 | 0.02 | 0.33 | 30.31 | 8.04 |
| 2004 | 0.58 | 3.12 | 0.01 | 0.13 | 33.45 | 8.58 |
| 2003 | 0.51 | 3.34 | 0.01 | 0.13 | 26.09 | 8.63 |
| 2002 | 0.38 | 3.75 | 0.01 | 0.03 | 24.35 | 8.24 |
| 2001 | 0.35 | 3.84 | 0.01 | 0.01 | 23.76 | 7.65 |
| 2000 | 0.32 | 5.12 | 0.01 | 0.00 | 22.38 | 5.66 |
| 1999 | 0.32 | 5.87 | 0.01 | 0.00 | 20.76 | 5.94 |
| 1998 | 0.31 | 5.74 | 0.02 | 0.00 | 19.38 | 5.80 |
| 1997 | 0.25 | 5.71 | 0.02 | 0.00 | 18.27 | 6.32 |
| 1996 | 0.22 | 5.47 | 0.02 | 0.00 | 13.85 | 7.77 |
| 1995 | 0.18 | 4.87 | 0.02 | 0.00 | 14.30 | 4.18 |
| 1994 | 0.16 | 4.48 | 0.02 | 0.00 | 6.91 | 4.10 |
| 1993 | 0.15 | 3.42 | 0.01 | 0.00 | 6.11 | 4.27 |
| 1992 | 0.12 | 3.67 | 0.01 | 0.00 | 4.91 | 4.97 |
| 1991 | 0.10 | 3.56 | 0.01 | 0.00 | 3.75 | 4.67 |
| 1990 | 0.08 | 3.89 | 0.01 | 0.00 | 3.30 | 4.46 |
| 1989 | 0.06 | 3.95 | 0.01 | 0.00 | 3.52 | 6.40 |
| 1988 | 0.00 | 4.61 | 0.00 | 0.00 | 2.96 | 6.06 |
| 1987 | 0.00 | 5.35 | 0.00 | 0.00 | 2.83 | 5.68 |
| 1986 | 0.00 | 5.73 | 0.00 | 0.00 | 2.34 | 6.77 |
| 1985 | 0.00 | 4.92 | 0.00 | 0.00 | 2.16 | 7.42 |
| 1984 | 0.00 | 4.59 | 0.00 | 0.00 | 1.62 | 7.20 |
| 1983 | 0.00 | 4.59 | 0.00 | 0.00 | 1.48 | 5.88 |
| 1982 | 0.00 | 4.14 | 0.00 | 0.00 | 0.74 | 6.33 |
| 1981 | 0.00 | 4.08 | 0.00 | 0.00 | 0.30 | 5.30 |
| 1980 | 0.00 | 4.56 | 0.00 | 0.00 | 0.00 | 5.90 |
| 1979 | 0.00 | 4.25 | 0.00 | 0.00 | 0.00 | 3.93 |
| 1978 | 0.00 | 4.05 | 0.00 | 0.00 | 0.00 | 3.79 |
| 1977 | 0.00 | 4.17 | 0.00 | 0.00 | 0.00 | 3.40 |
| 1976 | 0.00 | 4.36 | 0.00 | 0.00 | 0.00 | 3.14 |
| 1975 | 0.00 | 4.14 | 0.00 | 0.00 | 0.00 | 2.78 |
| 1974 | 0.00 | 4.41 | 0.00 | 0.00 | 0.00 | 2.65 |
| 1973 | 0.00 | 4.68 | 0.00 | 0.00 | 0.00 | 2.67 |
| 1972 | 0.00 | 4.68 | 0.00 | 0.00 | 0.00 | 2.58 |
| 1971 | 0.00 | 4.64 | 0.00 | 0.00 | 0.00 | 1.60 |
| 1970 | 0.00 | 4.68 | 0.00 | 0.00 | 0.00 | 1.57 |
| 1969 | 0.00 | 4.22 | 0.00 | 0.00 | 0.00 | 1.60 |
| 1968 | 0.00 | 4.28 | 0.00 | 0.00 | 0.00 | 1.67 |
| 1967 | 0.00 | 3.97 | 0.00 | 0.00 | 0.00 | 1.74 |
| 1966 | 0.00 | 3.97 | 0.00 | 0.00 | 0.00 | 1.85 |
| 1965 | 0.00 | 3.81 | 0.00 | 0.00 | 0.00 | 1.90 |
| 1964 | 0.00 | 3.42 | 0.00 | 0.00 | 0.00 | 2.31 |
| 1963 | 0.00 | 3.46 | 0.00 | 0.00 | 0.00 | 2.57 |
| 1962 | 0.00 | 3.33 | 0.00 | 0.00 | 0.00 | 2.68 |
| 1961 | 0.00 | 3.17 | 0.00 | 0.00 | 0.00 | 2.95 |
| 1960 | 0.00 | 3.27 | 0.00 | 0.00 | 0.00 | 3.11 |
Sources: State Energy Data Report. Energy Information Administration, Washington, DC. Nebraska Department of Environment and Energy, Lincoln, NE.
Notes: Totals may not equal the sum of the components due to independent rounding. NA = Not Available. (s) = Btu value less than 0.05. In October 2023, the Energy Information Administration (EIA) updated the way they calculate primary energy consumption of electricity generation from noncombustible renewable energy sources (solar, wind, hydroelectric, and geothermal). Beginning with the 2022 State Energy Data System (SEDS) data cycle, EIA calculated consumption of noncombustible renewable energy for electricity generation using the captured energy approach, which applies a constant conversion factor of 3,412 British thermal units per kilowatthour (Btu/kWh), that is, the heat content of electricity. This approach is a change from EIA's old methodology, called the fossil fuel equivalency approach. The captured energy approach is more consistent with international energy statistics standards than fossil fuel equivalency. For renewable–sourced electricity generation, EIA used the fossil fuel equivalency approach to convert the data that they collected in kWh to Btu. For this method, EIA used the average annual heat rate in Btu/kWh of the nation’s fossil fuel–fired power plants (natural gas, coal, petroleum). The resulting Btu value is the equivalent amount of fossil fuels that would need to be consumed to produce the same amount of electricity from these noncombustible energy sources. For the captured energy approach, instead of using the average annual heat rate of the nation’s fossil–fuel fired power plants, which can vary from year to year, EIA used the constant conversion factor of 3,412 Btu/kWh.
1 Other petroleum includes the subtotal of sixteen (16) petroleum products consumed in the industrial sector.