Annual Electricity Generation in Nebraska by Fuel Type
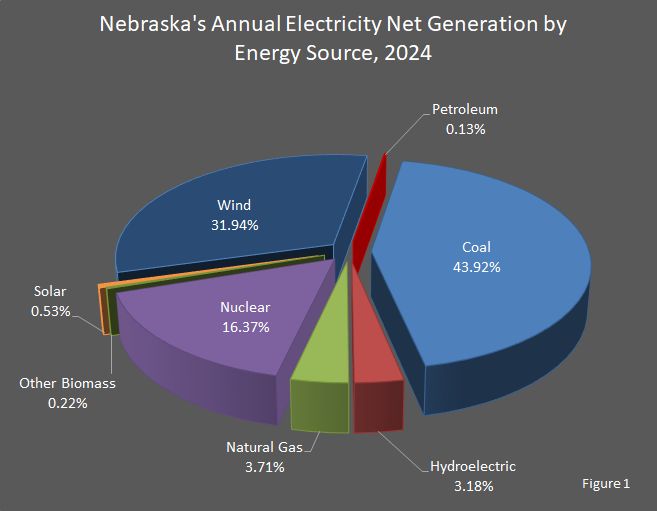
Electricity generation increased 6.0 percent to 37,228,950 megawatthours in 2024 from 39,445,955 megawatthours in 2023. As shown in Figure 1, most of Nebraska's electricity was generated by coal plants, wind facilities, and nuclear power plants (43.92 percent, 31.94 percent, and 16.37 percent, respectively). Plants using natural gas generated 3.71 percent, hydroelectric power generated 3.18 percent, other biomass generated 0.22 percent, solar generated 0.53 percent, and petroleum generated 0.13 percent.
In 2024, electricity generation from solar increased 146.94 percent, generation by petroleum increased by 36.17 percent, generation by hydroelectric power increased 3.48 percent, and generation by wind increased 0.39 percent from 2023. Electricity generation by nuclear power decreased 11.99 percent, generation by other biomass decreased 9.11 percent, generation by coal decreased 8.73 percent, and generation by natural gas decreased 2.08 percent from 2023.
In 2016, generation by petroleum decreased to -17,940, which meant the facilities used more electricity than they produced. Since 2021, generation by other energy sources has been a negative number. Other energy sources includes non–biogenic municipal solid waste, batteries, chemicals, hydrogen, pitch, purchased steam, sulfur, tire–derived fuels, and miscellaneous technologies.
Nuclear electric power generation decreased 37 percent from 2010 to 2011 and 16.32 percent from 2011 to 2012, which was due to the shutdown of the Fort Calhoun Nuclear Plant for the 2010 maintenance period and then from the 2011 flood.
There was an increase in electricity generation from other biomass from electric generators, electric utilities, between 1992–1998, because the Sheldon plant, operated by Nebraska Public Power District, was producing electricity from tire chips. There was no generation reported from this renewable energy source after 1998. The process was discontinued, because it was not considered cost–effective.
Also see the Units and Capacity report, the Units and Capacity by Energy Source report, and the Units and Capacity by Energy Source and Year of Initial Operation report for additional information.
| Attachment | Size |
|---|---|
| 2024 | 114.57 KB |
| 2022-2023 | 157.37 KB |
| 2020-2021 | 391.56 KB |
| 2018-2019 | 388.83 KB |
| 2016-2017 | 384.57 KB |
| 2013-2015 | 405.44 KB |
| 2010-2012 | 426.63 KB |
| 2008-2009 | 328.38 KB |
| 2006-2007 | 328.62 KB |
| 2004-2005 | 327.84 KB |
| 2002-2003 | 327 KB |
| 2000-2001 | 329.2 KB |
| 1998-1999 | 325.42 KB |
| 1997-1996 | 323.62 KB |
| 1994-1995 | 313.77 KB |
| 1992-1993 | 314.49 KB |
| 1990-1991 | 306.45 KB |
Sources: Electric Power Annual. Energy Information Administration, Washington, DC. Nebraska Department of Water, Energy, and Environment, Lincoln, NE.
Notes: Totals may not equal the sum of the components due to independent rounding, and totals from one table to the next may not be equivalent.
Coal includes anthracite, bituminous coal, subbituminous coal, lignite, waste coal, and synthetic coal.
Other includes non–biogenic municipal solid waste, batteries, chemicals, hydrogen, pitch, purchased steam, sulfur, tire–derived fuels, and miscellaneous technologies.
Other Biomass includes biogenic municipal solid waste, landfill gas, sludge waste, agricultural byproducts, other biomass solids, other biomass liquids, and other biomass gases (including digester gases and methane).
Other Gases include blast furnace gas, propane gas, and other manufactured and waste gases derived from fossil fuels.
Petroleum includes distillate fuel oil (all diesel and No. 1, No. 2, and No. 4 fuel oils), residual fuel oil (No. 5 and No. 6 fuel oils and bunker C fuel oil), jet fuel, kerosene, petroleum coke, and waste oil.
Wood and Wood–Derived Fuels include paper pellets, railroad ties, utility poles, wood chips, bark, red liquor, sludge wood, spent sulfite liquor, and black liquor, with other wood waste solids and wood–based liquids.