Petroleum Remediation Trends and Statistics
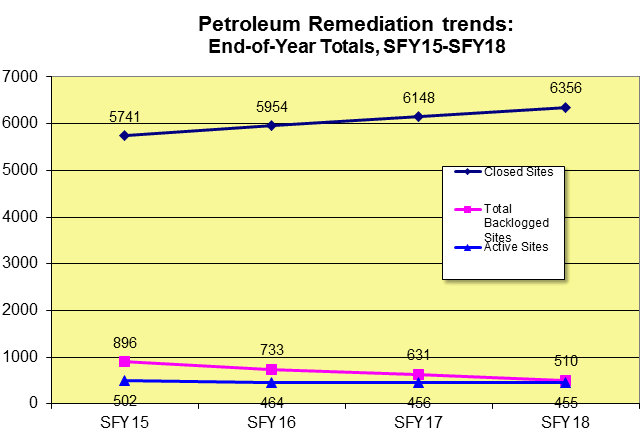
The following is a chart of end of year totals for the past four years relating to Petroleum Remediation sites in Nebraska.
The chart provides information relating to:
- Closed Sites: Sites that have been closed either because they have been cleaned up or it has been determined that no cleanup is necessary
- Backlogged Sites: Sites identified as potentially needing cleanup, but are on a waiting list for further investigation
- Active Sites: Sites that are currently being actively investigated or remediated

Cumulative Charts
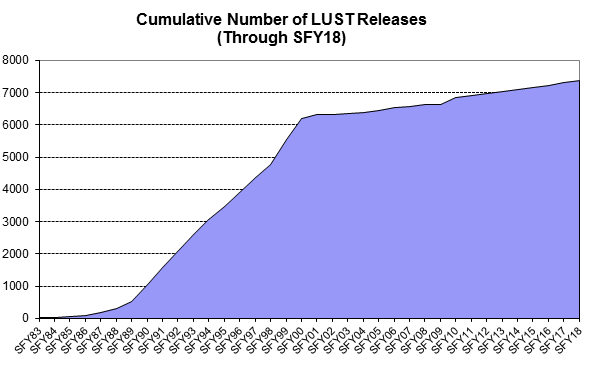
The first chart below shows the cumulative number of sites that have had releases identified.
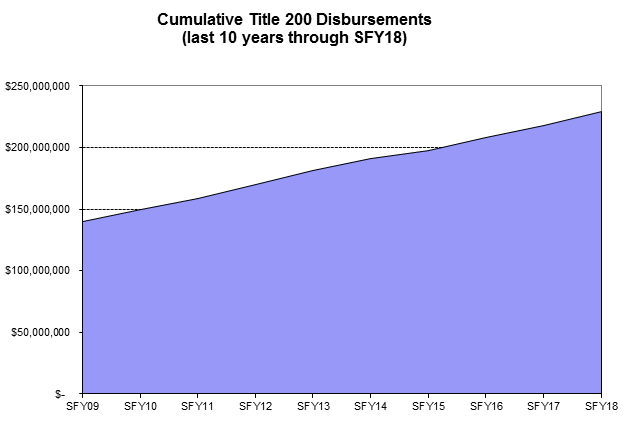
The second chart shows the cumulative amount that the program has spent on investigation and cleanup in the past several years.


