Motor Gasoline and Ethanol-Blended Fuel Consumption in Nebraska
The total of both motor gasoline consumption and ethanol–blended fuel consumption in 2023 was 1.2 percent higher than in 2022 as shown in the data table below.
Total consumption of motor gasoline and ethanol–blended fuel in the month of December 2023 was 73,800,042 gallons, which was 1.3 percent higher than the previous month and 1.3 percent higher than December 2022.
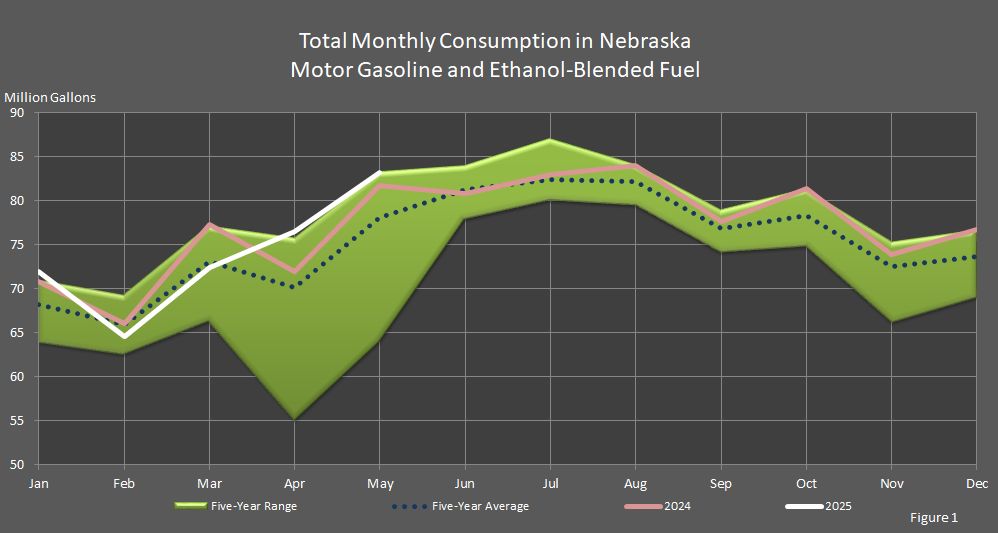
Figure 1 shows that December 2023's consumption was higher than December 2022's consumption, in the five–year range, and above the five–year average.
The driving season is traditionally the months between the Memorial Day and Labor Day weekends each year, so the months of June, July, and August usually have higher demand for these transportation fuels.
The reports on motor gasoline consumption and ethanol–blended fuel consumption have additional information in relation to the total of motor gasoline consumption and ethanol–blended fuel consumption.
Motor Gasoline and Ethanol-Blended Fuel Consumption in Nebraska
2001 – 2023
(Gallons)
Year | Jan | Feb | Mar | Apr | May | Jun | Jul | Aug | Sep | Oct | Nov | Dec | Annual Total |
---|---|---|---|---|---|---|---|---|---|---|---|---|---|
2023 | 67,865,112 | 64,667,580 | 75,053,144 | 74,041,387 | 83,401,088 | 83,001,331 | 81,762,533 | 84,220,629 | 77,230,276 | 81,388,605 | 72,884,430 | 73,800,042 | 919,316,157 |
2022 | 67,446,135 | 67,183,575 | 74,032,809 | 73,645,418 | 80,458,529 | 80,459,254 | 80,095,761 | 80,132,509 | 79,046,328 | 76,887,001 | 75,408,872 | 72,851,601 | >907,647,792 |
2021 | 63,971,723 | 62,615,907 | 72,581,690 | 75,932,758 | 80,492,285 | 84,122,948 | 87,130,757 | 82,860,960 | 76,432,434 | 77,054,870 | 74,295,093 | 76,102,217 | 913,593,642 |
2020 | 71,106,090 | 69,418,840 | 66,386,484 | 55,094,932 | 64,118,018 | 77,916,475 | 80,377,984 | 79,520,590 | 74,174,354 | 74,891,555 | 66,178,434 | 69,068,719 | 848,252,475 |
2019 | 70,547,615 | 64,136,305 | 72,494,859 | 76,479,048 | 80,872,121 | 81,434,229 | 85,280,244 | 83,897,365 | 76,967,235 | 81,042,201 | 74,844,532 | 74,214,999 | 922,210,753 |
2018 | 68,823,069 | 64,197,248 | 74,809,055 | 71,904,982 | 82,295,523 | 81,724,725 | 82,241,325 | 83,428,788 | 75,382,129 | 77,877,095 | 76,376,705 | 73,439,048 | 912,499,692 |
2017 | 66,297,705 | 63,515,280 | 75,126,421 | 72,323,698 | 81,249,046 | 83,190,992 | 80,899,757 | 84,957,098 | 73,759,972 | 77,462,836 | 74,757,474 | 75,692,355 | 909,232,634 |
2016 | 68,872,406 | 65,237,543 | 73,045,815 | 72,947,102 | 78,477,927 | 82,263,541 | 81,862,773 | 81,403,424 | 77,166,983 | 75,843,181 | 74,432,096 | 75,587,476 | 907,140,267 |
2015 | 68,991,777 | 63,715,452 | 69,679,308 | 72,884,008 | 75,379,479 | 78,039,480 | 81,830,127 | 79,400,132 | 71,713,210 | 77,244,420 | 70,483,286 | 69,940,552 | 879,301,231 |
2014 | 67,542,101 | 65,072,874 | 83,329,722 | 70,256,577 | 76,292,748 | 73,828,614 | 80,907,433 | 75,699,479 | 69,921,967 | 73,538,527 | 70,057,808 | 73,196,665 | 879,644,515 |
2013 | 64,017,377 | 58,966,566 | 65,145,786 | 66,823,395 | 73,990,403 | 73,798,962 | 78,218,900 | 76,921,908 | 67,816,758 | 73,158,675 | 71,041,631 | 72,271,437 | 842,171,801 |
2012 | 64,805,302 | 62,396,090 | 67,815,299 | 67,452,722 | 74,789,400 | 75,456,489 | 75,330,186 | 74,390,303 | 65,220,088 | 71,133,356 | 66,530,149 | 66,380,762 | 831,700,146 |
2011 | 63,897,314 | 59,773,743 | 66,278,779 | 65,458,949 | 69,464,805 | 72,470,084 | 74,416,630 | 75,337,483 | 70,536,484 | 68,156,393 | 68,026,634 | 68,847,923 | 822,665,221 |
2010 | 61,255,104 | 60,146,552 | 66,411,745 | 69,083,642 | 71,003,979 | 75,106,842 | 79,495,590 | 76,304,635 | 72,015,115 | 70,706,681 | 69,127,648 | 73,593,034 | 844,250,567 |
2009 | 64,044,822 | 59,560,170 | 63,780,726 | 60,655,451 | 72,486,184 | 72,927,490 | 79,848,158 | 71,674,511 | 70,981,667 | 69,229,569 | 66,494,689 | 66,285,104 | 817,968,541 |
2008 | 64,436,992 | 62,124,307 | 65,376,364 | 65,913,463 | 69,552,777 | 68,813,866 | 73,829,957 | 77,300,626 | 67,613,275 | 70,088,547 | 67,248,501 | 72,933,398 | 825,232,073 |
2007 | 66,288,679 | 59,618,079 | 66,885,597 | 67,702,484 | 70,974,633 | 72,489,090 | 74,766,738 | 75,129,037 | 68,491,995 | 72,152,144 | 67,856,373 | 66,301,764 | 756,576,765 |
2006 | 62,064,636 | 61,106,531 | 65,221,568 | 66,005,286 | 69,776,026 | 73,434,619 | 70,945,889 | 72,776,455 | 66,956,495 | 70,212,126 | 68,475,998 | 68,674,923 | 815,650,552 |
2005 | 59,885,575 | 56,812,671 | 69,261,164 | 63,909,771 | 72,200,538 | 75,415,551 | 76,733,461 | 79,278,235 | 64,806,461 | 66,752,160 | 65,843,831 | 71,183,207 | 822,082,625 |
2004 | 65,988,208 | 60,627,361 | 67,420,309 | 67,440,267 | 69,743,122 | 72,844,885 | 77,580,255 | 73,426,107 | 71,772,722 | 71,913,058 | 67,804,518 | 75,364,176 | 841,924,988 |
2003 | 67,676,679 | 57,664,236 | 64,456,595 | 64,423,591 | 75,385,756 | 73,197,846 | 79,618,036 | 78,265,198 | 71,979,025 | 73,496,678 | 67,662,209 | 73,235,512 | 847,061,361 |
2002 | 65,575,599 | 60,411,966 | 63,387,755 | 66,924,566 | 75,778,317 | 72,768,803 | 80,776,184 | 79,900,559 | 69,803,818 | 73,995,843 | 69,367,820 | 71,664,606 | 850,355,836 |
2001 | 59,947,919 | 57,883,009 | 64,384,908 | 63,787,370 | 69,631,410 | 74,521,137 | 76,128,058 | 79,275,607 | 69,506,847 | 73,439,718 | 70,427,809 | 71,024,902 | 829,958,694 |
Sources: "Monthly Motor–Fuel Consumption." Nebraska Department of Revenue, Motor Fuels Division, Lincoln, NE. Nebraska Department of Environment and Energy, Lincoln, NE.
Notes: The numbers are net volume numbers which exclude motor fuel for aviation use, nonhighway agricultural use, and industrial use. NA indicates data is not available. Numbers in red have been revised.