Consumption in the Industrial Sector
The industrial sector consists of manufacturing, construction, mining, agriculture, and forestry organizations. Energy used by this sector to transport products to market or inputs to the organizations is included in the transportation sector.
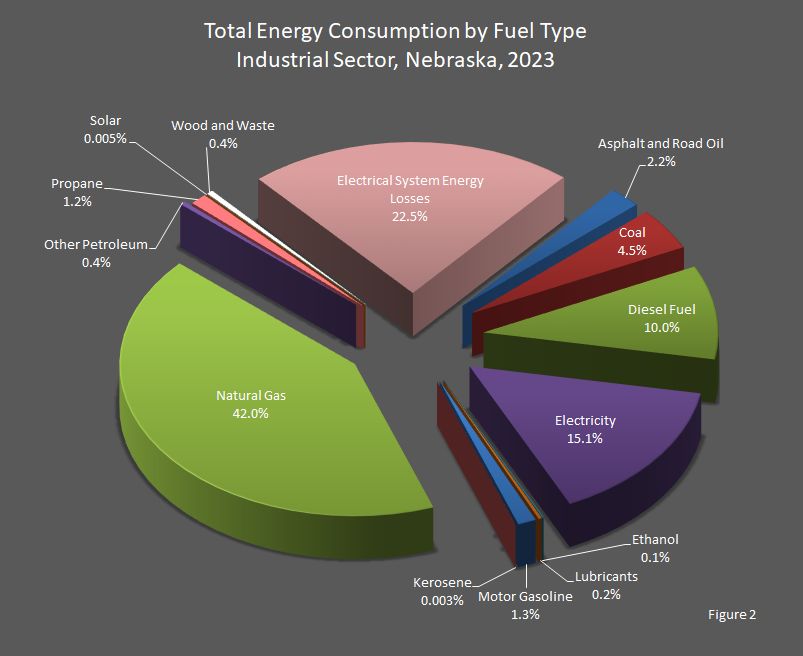
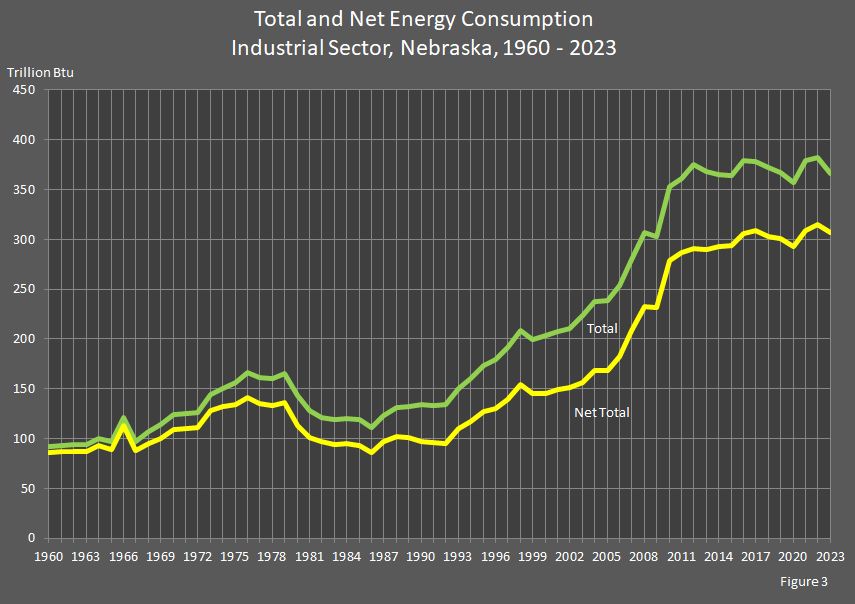
For the residential, commercial, and industrial sectors, a net total or net energy consumption (less electrical system energy losses) is provided to indicate the energy actually consumed by these sectors. In addition, energy consumed in the generation, transmission, and distribution of electricity (electrical system energy losses) is allocated to each sector based on the electricity consumed by the sector. Thus, total energy consumption represents the energy consumed by the sector as well as that used to provide electricity to the sector.
Between 2022 and 2023, industrial sector net energy use decreased 2.3 percent to 307.1 trillion British thermal units (Btu). Total energy consumption attributed to the industrial sector in 2023 was 366.1 trillion Btu, a decrease of 4.1 percent from 2022. Electricity use decreased 12.1 percent, petroleum use decreased less than one percent (0.98%), natural gas use increased 6.1 percent, renewable energy use increased less than one percent (0.50%), and coal use decreased 30.6 percent from 2022. Renewable energy consumption was comprised of ethanol, solar, and biomass (wood and waste).
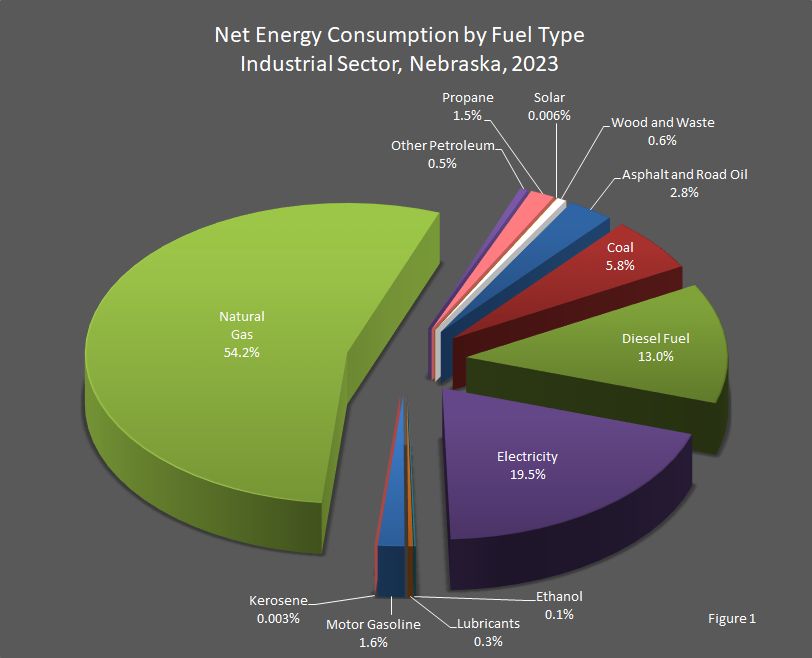
In 2023, 66.3 percent of the industrial sector's energy needs were met by natural gas (35.9%), petroleum (13.1%), coal (3.9%), electricity (12.9%) and renewable energy (0.46%) comprised the rest of the energy consumed in the industrial sector (Figure 1).
The majority of the petroleum products consumed by the industrial sector in 2023 were diesel fuel (65.7 percent of petroleum products), asphalt and road oil (14.4 percent), motor gasoline (8.3 percent), and propane (7.7 percent). The rest of the products each comprised less than three percent of petroleum products.
Other petroleum products include sixteen (16) separate products, all of which are assigned to the industrial sector. The sixteen products are:
- aviation gasoline blending components;
- crude oil;
- motor gasoline blending components;
- natural gasoline, including isopentane;
- pentanes plus;
- petrochemical feedstocks, naphtha;
- petrochemical feedstocks, other oils;
- petrochemical feedstocks, still gas;
- petroleum coke;
- plant condensate;
- special naphthas;
- still gas;
- unfinished oils;
- unfractionated streams;
- waxes; and
- miscellaneous.
- Miscellaneous products vary from inexpensive (absorption oils similar to kerosene) to very expensive (hydraulic fluids) products. The greater part of the miscellaneous product line consists of finished petrochemicals, especially the aromatic hydrocarbons: benzene, toluene, and the xylenes.
| Attachment | Size |
|---|---|
| 2020 - 2023 | 44.47 KB |
| 2000 - 2019 | 47.65 KB |
| 1980 - 1999 | 47.71 KB |
| 1960 - 1979 | 47.77 KB |
Sources: State Energy Data Report. Energy Information Administration, Washington, DC. Nebraska Department of Water, Energy, and Environment, Lincoln, NE.
This report was updated on December 8, 2025.
Typically, there is a year between updates.