
Consumption in the Residential Sector


The residential sector consists of private households. Energy is consumed primarily for space heating, water heating, air conditioning, refrigeration, cooking, clothes drying, and lighting. Fuel used for motor vehicles by household members is included in the transportation sector.

For the residential, commercial, and industrial sectors, a net total or net energy consumption (less electrical system energy losses) is provided to indicate the energy actually consumed by these sectors. In addition, energy consumed in the generation, transmission, and distribution of electricity (electrical system energy losses) is allocated to each sector based on the electricity consumed by the sector. Thus, total energy consumption represents the energy consumed by the sector as well as that used to provide electricity to the sector.
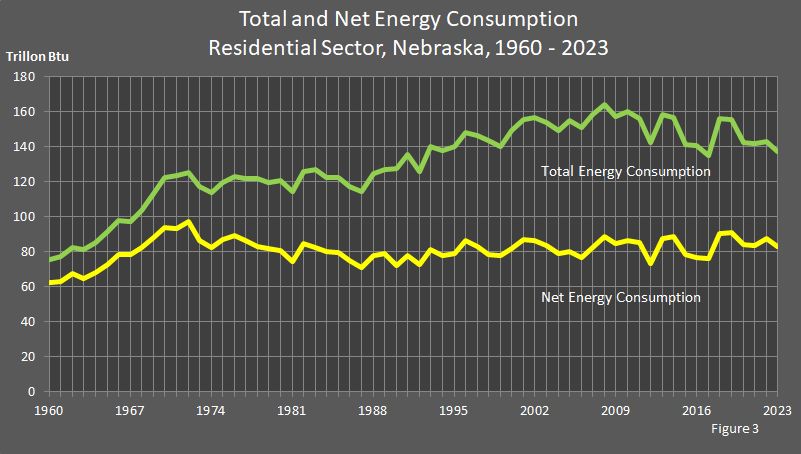
Between 2021 and 2022, residential sector net energy use increased 5.07 percent to 87.2 trillion British thermal units (Btu), which was 10.3 percent below the peak of 97.2 trillion Btu recorded in 1972.

Total energy consumption attributed to the residential sector in 2022 was 143.0 trillion Btu, an increase of 1.0 percent from 2021. Natural gas use increased 7.7 percent, and electricity use increased 4.7 percent. Petroleum use decreased 5.9 percent, and renewable energy use decreased 2.2 percent from 2021. Coal consumption remained at a level low enough to round to zero.
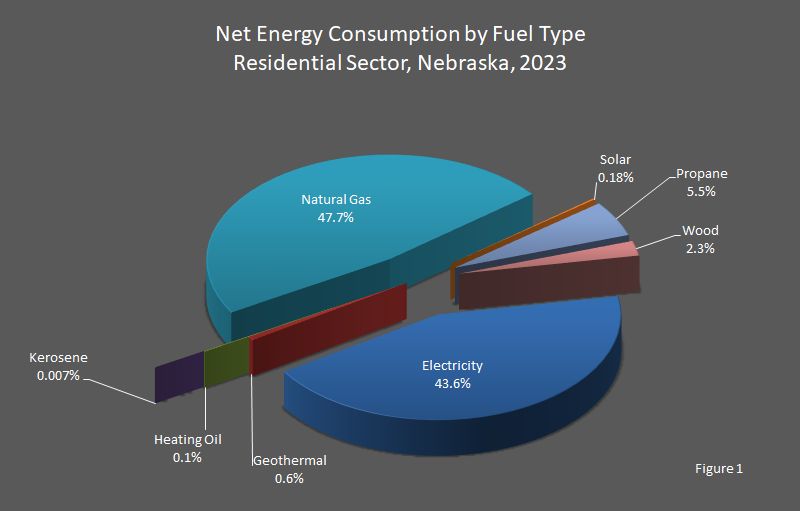
In 2022, 47.8 percent of the residential sector's energy needs were met by natural gas. Forty–three percent (43.0%) of the energy consumed in the residential sector was electricity, 6.8 percent were petroleum products, and 2.6 percent was renewable energy. According to the 2022 American Community Survey, 59 percent of Nebraska's households used natural gas for home heating, 32 percent used electricity, 7 percent used propane, 0.3 percent used heating oil, and 0.004 percent used coal.


Energy Consumption by Fuel Type, Residential Sector Nebraska, 2020 – 2022

[Trillion British Thermal Units (Btu)]

YearCoalElectricityNatural GasPetroleumRenewableNet
Energy
Consumption
Electrical
System
Energy
Losses
Total
Energy
Consumption
Heating
Oil
KerosenePropaneGeothermalPhotovoltaic and Solar Thermal 1Wood
20220.00037.47641.6480.0990.0035.8150.4920.1101.66387.19655.789143.027
20210.00035.80038.6650.0940.0036.1920.4920.0801.74382.98958.573141.562
20200.00035.87739.4750.0640.0026.4690.4920.0701.72584.10458.301142.462


Energy Consumption by Fuel Type, Residential Sector Nebraska, 2000 – 2019

[Trillion British Thermal Units (Btu)]

YearCoalElectricityNatural GasPetroleumRenewableNet
Energy
Consumption
Electrical
System
Energy
Losses
Total
Energy
Consumption
Heating
Oil
KerosenePropaneGeothermalPhotovoltaic and Solar Thermal 1Wood
20190.00035.17144.5410.0700.0047.8150.4920.0603.08591.17864.253155.451
20180.00035.52644.9230.0770.0036.5430.4920.0502.80690.37065.748156.010
20170.00032.98736.1420.0840.0024.5690.4920.0401.82776.10359.052135.021
20160.00033.22734.9920.0760.0065.5290.4920.0352.23976.56164.166140.746
20150.00032.52436.6280.0830.0035.9100.4920.0322.39978.39262.882141.298
20140.00034.21643.9240.1010.0076.5890.4920.0302.97388.69268.462157.086
20130.00034.33242.7240.1140.0037.2500.4920.0302.93887.74770.556158.332
20120.00033.02931.8750.1020.0035.9010.4920.0282.25273.56468.690142.280
20110.00033.93940.1540.1380.0037.7130.8310.0272.69485.58670.345155.956
20100.00034.48440.2900.1600.0188.3750.3000.0262.77886.40174.046160.470
20090.00032.84740.6310.2050.0158.2860.2660.0252.59084.84072.270157.146
20080.00033.28642.8250.3180.0159.3640.2140.0252.49788.51775.499164.053
20070.01233.25939.2880.3040.0357.0200.1790.0232.23282.32976.142158.502
20060.01131.70936.3360.5900.0146.0300.1480.0202.01976.85774.123151.009
20050.00631.76338.3310.5140.0387.0900.1280.0152.27780.14774.814154.986
20040.00729.87838.9600.5600.0316.5590.1120.0113.04679.15370.359149.532
20030.01630.20442.4980.5210.0257.4680.1030.0122.97283.80770.068153.895
20020.01730.55844.1890.3960.0178.2690.0790.0122.82486.34970.638157.010
20010.01429.47447.4460.4730.0596.8210.0790.0132.78287.14868.628155.797
20000.00028.47742.5870.6420.0457.3040.0740.0142.78881.91767.261149.201


Energy Consumption by Fuel Type, Residential Sector Nebraska, 1980 – 1999

[Trillion British Thermal Units (Btu)]

YearCoalElectricityNatural GasPetroleumRenewableNet
Energy
Consumption
Electrical
System
Energy
Losses
Total
Energy
Consumption
Heating
Oil
KerosenePropaneGeothermalPhotovoltaic and Solar Thermal 1Wood
19990.00027.05540.5290.4470.0367.1740.0740.0142.58977.90462.540140.468
19980.00027.84340.8820.3760.0547.0120.0650.0152.52378.75564.736143.515
19970.22527.25746.9500.5240.0405.2970.0630.0152.83983.19563.392146.608
19960.00326.41249.2070.6580.0216.5940.0590.0153.65686.61061.642148.277
19950.02425.92044.1200.5120.0214.9130.0560.0153.52079.08661.120140.228
19940.02325.17943.4050.8530.0304.5630.0520.0163.52077.62560.153137.800
19930.02024.65546.7350.9800.0604.9020.0560.0103.70981.11759.111140.245
19920.02322.38839.9860.8400.0585.2140.0530.0104.41972.98153.025126.022
19910.04524.35643.2131.1470.0315.1390.0490.0094.21278.19257.177135.384
19900.01723.20039.9311.1420.0244.0960.0450.0094.01772.47255.161127.649
19890.02222.94143.4401.6900.0465.0680.0410.0085.92379.17147.851127.037
19880.18123.24742.0731.2200.0915.0040.0000.0005.85877.67447.208124.890
19870.01921.76337.4901.2930.0745.1140.0000.0005.48971.24243.426114.675
19860.01921.58041.1291.7320.1053.7240.0000.0006.58174.87042.747117.623
19850.05721.13644.8232.0590.2274.1810.0000.0007.22579.70842.951122.665
19840.36721.38646.0491.7740.3143.2080.0000.0007.01480.11242.416122.532
19830.18721.96845.6611.4440.2627.1580.0000.0005.72882.40844.447126.865
19820.08819.94350.3802.1320.1646.0180.0000.0006.16884.89340.941125.841
19810.05119.11242.3972.2430.1645.4930.0000.0005.15874.61839.850114.475
19800.07218.83847.9432.0950.0575.8860.0000.0005.74080.63140.073120.712


Energy Consumption by Fuel Type, Residential Sector Nebraska, 1960 – 1979

[Trillion British Thermal Units (Btu)]

YearCoalElectricityNatural GasPetroleumRenewableNet
Energy
Consumption
Electrical
System
Energy
Losses
Total
Energy
Consumption
Heating
Oil
KerosenePropaneGeothermalPhotovoltaic and Solar Thermal 1Wood
19790.22117.95753.3852.6520.1475.9800.0000.0001.51481.85637.850119.714
19780.09818.24448.2101.5491.63411.9940.0000.0001.41083.13938.949122.103
19770.08216.57952.9511.3272.13211.7650.0000.0001.41086.24635.695121.957
19760.05516.11254.7741.4712.42913.2760.0000.0001.30789.42433.450122.892
19750.05016.01453.6151.0092.10713.1630.0000.0001.20487.16232.696119.875
19740.08415.39649.7601.0592.33112.7490.0000.0001.10182.48031.569114.066
19730.16415.13651.0081.2233.04014.7330.0000.0001.04986.35330.954117.327
19720.36013.92660.8611.2603.01216.7100.0000.0001.03297.16128.444125.627
19710.32914.70158.1391.1022.55415.6850.0000.0001.03293.54229.908123.471
19700.41014.01458.7611.1432.14816.2890.0000.0001.03293.79728.706122.524
19690.81412.56255.0530.8582.05115.8990.0000.0001.08488.32125.013113.354
19680.41110.57553.2690.9702.49413.5670.0000.0001.15282.43821.211103.669
19670.3969.60853.6040.9530.52612.3440.0000.0001.22178.65218.95697.624
19660.5539.72552.6920.8841.95611.1350.0000.0001.30778.25219.54397.810
19650.7189.60747.2020.6492.56810.6600.0000.0001.37672.78018.89691.691
19640.9258.89744.6560.8741.3379.8520.0000.0001.49668.03717.50085.549
19631.3038.33140.3400.7591.29410.9970.0000.0001.65164.67516.47281.160
19621.9017.57944.6690.7541.9089.0830.0000.0001.82367.71714.75982.487
19611.8187.10441.6430.8381.8228.1230.0000.0001.97863.32614.08377.419
19602.6916.50840.8790.8131.9127.4980.0000.0002.15062.45113.12275.583


Sources: State Energy Data Report. Energy Information Administration, Washington, DC. Nebraska Department of Environment and Energy, Lincoln, NE.

Notes: Totals may not equal the sum of the components due to independent rounding.

1 The solar data includes small amounts of solar thermal and photovoltaic energy consumed by the commercial sector that cannot be separately identified.