Consumption by Fuel Type
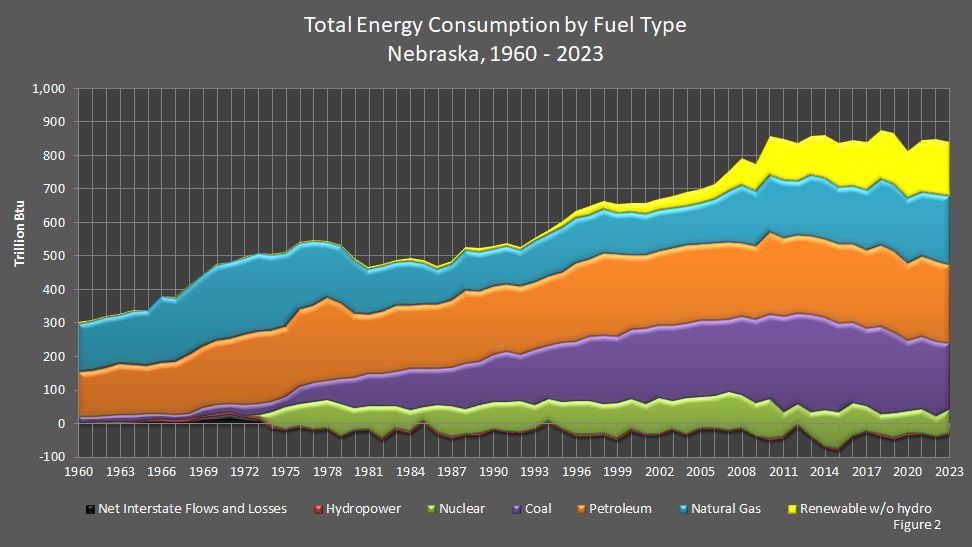
Nebraska's total energy consumption in 2023 was 840 trillion British thermal units (Btu), which was a 0.9 percent decrease from 2022. Total energy consumption is consumption of primary resources and end–use energy. According to the Energy Consumption Comparison by State report, Nebraska had the 18th lowest (34th highest) energy consumption in the country, which was less than one percent (0.9 percent) of the nation's total consumption. Using energy consumption per capita for comparison, Nebraska was the 8th highest in the country.
Primary resource consumption includes energy used in the generation of electricity whether that electricity is used in Nebraska or not. In 2023, consumption of primary energy resources was 883 trillion Btu, which was a 1.6–percent decrease from 2022. The first table under the graphs provides primary resources' consumption.
End–use energy consumption refers to the energy content of electricity and other fuels at the point of use by consumers. Unless otherwise noted, total energy consumption refers to total primary energy consumption adjusted for net interstate sales of electricity. Net interstate sales represent the difference between the energy in electricity sold, including the associated losses, and the energy input at electric utilities in Nebraska. Net interstate sales will be a negative number if Nebraska sold, or exported, electricity; and net interstate sales will be a positive number if Nebraska had to buy, or import, electricity. A percentage of the primary energy used to generate and distribute electricity is lost as waste heat. This loss is referred to as associated energy losses, electric system losses, or net interstate flows and losses of electricity.
In 2023, Nebraska's energy needs were met by petroleum (28 percent), coal (22 percent), natural gas (23 percent), renewable energy (19 percent), and nuclear electric power (8 percent). (Figure 1) (To see a pie chart of electricity generation fuels, go to the Annual Electricity Generation by Fuel Type report.)
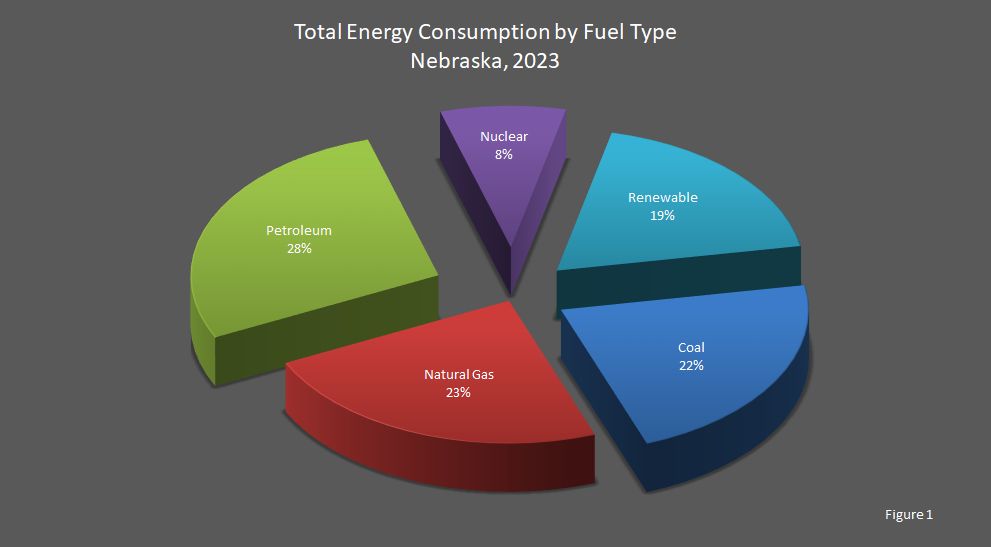
From 2022 to 2023, nuclear electric power use increased 23.3 percent, and natural gas use increased 3.6 percent. Coal use decreased 12.5 percent, renewable energy use decreased 2.3 percent, and petroleum use decreased 1.7 percent.
Petroleum products are listed in the second set of tables below. Petroleum is divided into ten fuels or categories of fuels: distillate fuel (47 percent of petroleum), motor gasoline (43 percent), propane (4 percent), jet fuel (3 percent), asphalt and road oil (3 percent), other petroleum (1.12 percent), lubricants (0.63 percent), aviation gasoline (0.07 percent), residual fuel (0.01 percent), and kerosene (0.006 percent).
Other petroleum products include sixteen (16) separate products, all of which are assigned to the industrial sector. The sixteen products are:
- aviation gasoline blending components;
- crude oil;
- motor gasoline blending components;
- natural gasoline, including isopentane;
- pentanes plus;
- petrochemical feedstocks, naphtha;
- petrochemical feedstocks, other oils;
- petrochemical feedstocks, still gas;
- petroleum coke;
- plant condensate;
- special naphthas;
- still gas;
- unfinished oils;
- unfractionated streams;
- waxes; and
- miscellaneous.
- Miscellaneous products vary from inexpensive (absorption oils similar to kerosene) to very expensive (hydraulic fluids) products. The greater part of the miscellaneous product line consists of finished petrochemicals, especially the aromatic hydrocarbons: benzene, toluene, and the xylenes.
Renewable energy components are listed in the third set of tables below. Renewable energy consists of biofuels (69 percent of renewable energy), wind (25 percent of renewable energy), wood and waste (3 percent of renewable energy), conventional hydroelectric power (2 percent of renewable energy), geothermal (0.74 percent of renewable energy), and photovoltaic and solar thermal energy (0.28 percent of renewable energy). Note that Nebraska did use wind energy in 1998, 1999, and 2000 although the numbers were not large enough until 2001 to be included in the tables below. Also see Nebraska's renewable energy consumption report.
| Attachment | Size |
|---|---|
| Total Consumption 2020 - 2023 | 406.62 KB |
| Total Consumption 2000 - 2019 | 449.08 KB |
| Total Consumption 1980 - 1999 | 448.49 KB |
| Total Consumption 1960 - 1979 | 438.85 KB |
| Attachment | Size |
|---|---|
| Petroleum Products Consumption 2020 - 2023 | 392.4 KB |
| Petroleum Products Consumption 2000 - 2019 | 444.13 KB |
| Petroleum Products Consumption 1980 - 1999 | 443.48 KB |
| Petroleum Products Consumption 1960 - 1979 | 449.64 KB |
| Attachment | Size |
|---|---|
| Renewable Energy Consumption 2020 - 2023 | 479.31 KB |
| Renewable Energy Consumption 2000 - 2019 | 166.73 KB |
| Renewable Energy Consumption 1980 - 1999 | 162.87 KB |
| Renewable Energy Consumption 1960 - 1979 | 165.17 KB |
Sources: State Energy Data Report. Energy Information Administration, Washington, DC. Nebraska Department of Water, Energy, and Environment, Lincoln, NE.
This report was updated on October 17, 2025.
Typically, there is a year between updates.