Consumption in the Electric Power Sector

Energy Consumption in Nebraska's Electric Power Sector

The electric power sector consists of facilities which generate electricity primarily for use by the public.  Energy is used for the generation, distribution, and transmission of electric power.

Between 2020 and 2021, electric power sector energy use increased 3.2 percent to 380.1 trillion British thermal units (Btu). Nuclear electric power use increased 11.2 percent, natural gas use increased 3.7 percent, renewable energy use increased 2.9 percent, and coal use increased 0.4 percent. Petroleum use increased nearly four–fold.

The principal fuels used at electric utilities are coal (52.43 percent), renewable energy (25.31 percent), and nuclear electric power (18.91 percent). Natural gas (3.16 percent), petroleum (0.21 percent), and solar thermal and photovoltaic energy (0.14 percent) made up the other 3.51 percent of fuels consumed. Petroleum was comprised totally of distillate fuel oil.

In 2021, if there was consumption of geothermal energy in the electric power sector, it was comparatively small and rounded to zero.

More information on solar energy, geothermal energy, and wind energy in Nebraska is available.

Hydroelectric power data was included in the renewable fuels total, but is shown separately in the graphs and data tables below.
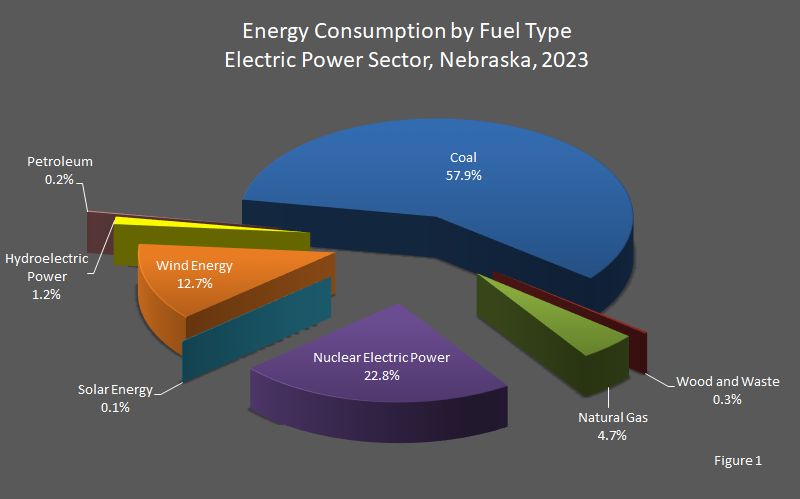
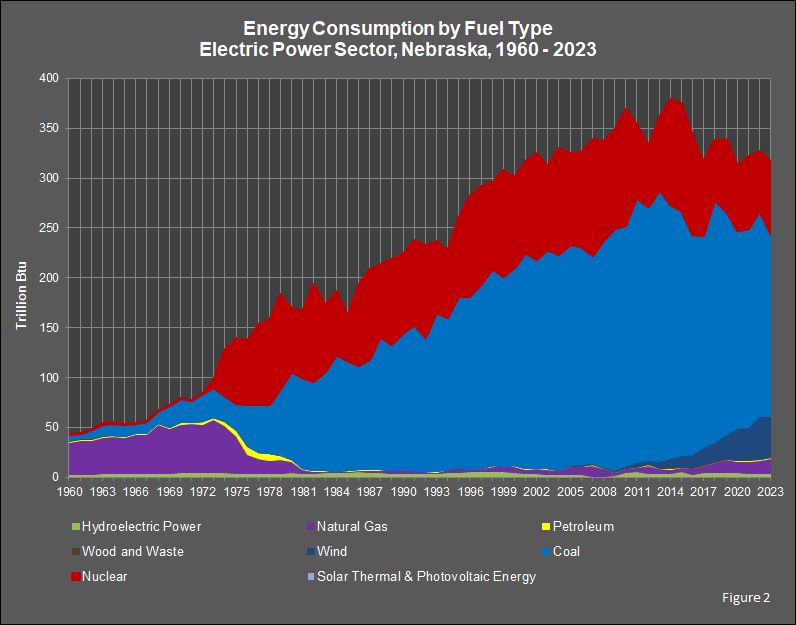
Nebraska Energy Consumption by Fuel Type, Electric Power Sector 2020 – 2021

[Trillion British Thermal Units (Btu)]

YearCoalNatural
Gas
Nuclear
Electric
Power
PetroleumRenewableElectricity
Net
Imports
Annual
Total
Distillate
Fuel
Petroleum
Coke
Residual
Fuel
Geothermal
Energy
Hydroelectric
Power
Solar
Thermal and
Photovoltaic
Energy
WindWood
and
Waste
2021199.29812.00271.8750.7820.0000.0000.0009.9330.53584.8320.8910.000380.124
2020198.58711.57564.6460.2170.0000.0000.00012.1870.47079.9140.8710.000368.463


Nebraska Energy Consumption by Fuel Type, Electric Power Sector 2000 – 2019

[Trillion British Thermal Units (Btu)]

YearCoalNatural
Gas
Nuclear
Electric
Power
PetroleumRenewableElectricity
Net
Imports
Annual
Total
Distillate
Fuel
Petroleum
Coke
Residual
Fuel
Geothermal
Energy
Hydroelectric
Power
Solar
Thermal and
Photovoltaic
Energy
WindWood
and
Waste
2019222.89012.93072.5900.2400.0000.0000.00011.9400.28064.2150.7800.000385.860
2018243.7419.74558.8840.1980.0000.0000.00012.5820.24750.5190.869-0.121376.628
2017212.7876.57072.3000.0940.0000.0000.00013.7190.14146.8400.8940.015353.329
2016220.4526.17197.7980.0910.0000.0000.0007.9060.03735.0670.8650.000368.384
2015245.1444.515107.9760.0920.0000.0000.00015.7020.00029.6390.7160.000403.784
2014254.5734.330105.6550.5690.0000.0000.00011.0100.00026.0280.642-0.001402.808
2013272.6594.72371.7360.5400.0000.0000.00010.7230.00017.1910.6190.000378.191
2012253.6707.86560.7950.2440.0000.0040.00011.9620.00012.2150.5820.000347.337
2011266.3394.26172.5490.3980.0000.0080.00015.7130.00010.2100.6490.000370.126
2010241.8113.961115.5400.3290.0000.0030.00012.8180.0004.1140.7310.000379.306
2009242.3263.32698.6820.2530.0000.0060.0004.2330.0003.7350.6450.000353.205
2008226.8497.27199.0750.4180.0000.0050.0003.4140.0002.1110.6000.000339.743
2007208.67211.079115.8150.3100.0000.1430.0003.4340.0002.1430.6150.031342.241
2006219.1687.82893.9430.2310.0000.0110.0008.8610.0002.5910.526–0.004333.155
2005220.7628.04691.8560.2570.0000.1190.0008.7140.0000.9660.475–0.014331.181
2004216.1023.295106.7960.2640.0000.0110.0009.1500.0000.3850.333–0.009336.321
2003219.3744.57783.3440.5890.0000.0040.00010.0370.0000.3910.4290.008318.635
2002209.8344.830105.6960.2470.0000.0030.00011.1650.0000.0820.0930.000331.951
2001216.4314.38291.1270.3580.0000.0030.00011.6160.0000.0270.1070.000324.051
2000198.5885.58989.9880.5840.0000.1180.00015.3090.0000.0000.1060.000310.282


Nebraska Energy Consumption by Fuel Type, Electric Power Sector 1980 – 1999

[Trillion British Thermal Units (Btu)]

YearCoalNatural
Gas
Nuclear
Electric
Power
PetroleumRenewableElectricity
Net
Imports
Annual
Total
Distillate
Fuel
Petroleum
Coke
Residual
Fuel
Geothermal
Energy
Hydroelectric
Power
Solar
Thermal and
Photovoltaic
Energy
WindWood
and
Waste
1999190.7684.626105.4520.3790.0000.0280.00017.5790.0000.0000.107–0.142318.796
1998197.4645.11986.6430.4810.0000.0660.00017.1600.0000.0000.098–0.165306.867
1997185.6182.71097.2670.4160.0000.0000.00017.0800.0000.0000.1600.002303.254
1996173.4682.32999.3250.2740.0000.0000.00016.5640.0000.0000.1190.000292.079
1995172.7363.08178.6500.3570.0000.0000.00014.7060.0000.0000.1680.000269.697
1994152.4443.02266.3210.2600.0000.0040.00013.5330.0000.0000.0960.000235.681
1993159.2661.85171.4810.2470.0000.0000.00010.3260.0000.0000.0590.000243.230
1992134.8081.83691.6050.1430.0000.0000.00011.1220.0000.0000.0670.000239.582
1991145.6303.45484.3720.1580.0000.0210.00010.9020.0000.0000.0000.000244.537
1990137.4583.53479.4850.1780.0000.0050.00011.8590.0000.0000.0000.000232.518
1989125.6542.46385.4800.2840.0000.3850.00012.0830.0000.0000.0000.000226.350
1988133.5031.91972.3910.3740.0000.4790.00013.940.0000.0000.0000.000222.605
1987110.5711.66789.6840.1940.0000.3720.00016.3290.0000.0000.0000.000218.816
1986103.6021.62881.0090.2930.0000.3300.00017.5280.0000.0000.0000.000204.390
1985110.3611.20143.9110.3580.0000.0000.00015.0510.0000.0000.0000.000170.882
1984116.8971.39062.6760.2400.0000.0000.00014.0370.0000.0000.0000.000195.240
198399.3921.47766.3210.4630.0000.0020.00014.1570.0000.0000.0000.000181.812
198290.1051.52596.9170.7680.0000.0020.00012.6720.0000.0000.0000.000201.989
198191.2804.23666.0480.4640.0000.0850.00012.5100.0000.0000.0000.000174.622
198088.43611.25763.0820.5010.0001.1050.00013.8750.0000.0000.0000.000178.256


Nebraska Energy Consumption by Fuel Type, Electric Power Sector 1960 – 1979

[Trillion British Thermal Units (Btu)]

YearCoalNatural
Gas
Nuclear
Electric
Power
PetroleumRenewableElectricity
Net
Imports
Annual
Total
Distillate
Fuel
Petroleum
Coke
Residual
Fuel
Geothermal
Energy
Hydroelectric
Power
Solar
Thermal and
Photovoltaic
Energy
WindWood
and
Waste
197966.37813.36494.1961.1940.0003.4300.00012.8990.0000.0000.0000.000191.460
197848.69812.43384.5221.9700.0005.8390.00012.3030.0000.0000.0000.000165.765
197748.52415.10780.2491.6180.0003.8380.00012.7380.0000.0000.0000.000162.075
197641.90619.04964.3351.6300.0006.2840.00013.2400.0000.0000.0000.000146.445
197526.78437.04665.1531.7970.0004.1390.00012.6240.0000.0000.0000.000147.543
197426.10347.22444.5961.4650.0003.1220.00013.5090.0000.0000.0000.000136.019
197330.12353.1116.5361.3330.0000.9620.00014.2430.0000.0000.0000.000106.308
197228.28348.3670.0001.6310.0001.1000.00014.2390.0000.0000.0000.00093.620
197121.73649.2330.0000.8170.0000.4800.00014.2410.0000.0000.0000.00086.508
197024.05048.0220.0000.7340.0001.1810.00014.3810.0000.0000.0000.00088.368
196921.94245.0800.0000.4330.0000.6990.00012.9280.0000.0000.0000.00081.082
196813.03548.4710.0000.3060.0000.4940.00013.0390.0000.0000.0000.00075.345
196712.14839.3210.0000.2560.0000.4130.00012.1310.0000.0000.0000.00064.268
196610.21539.3450.0000.2950.0000.4760.00012.1040.0000.0000.0000.00062.435
196511.93835.942–0.0640.4150.0000.6700.00011.6590.0000.0000.0000.00060.561
196412.24237.2851.0820.3540.0000.5700.00010.4850.0000.0000.3050.00062.322
196311.31536.1480.8860.6020.0000.9710.00010.6210.0000.0000.4260.00060.969
19629.51833.4730.0000.4960.0000.8000.00010.2930.0000.0000.3870.00054.967
19615.18334.2570.0000.3700.0000.5960.0009.8800.0000.0000.5190.00050.807
19606.33532.0570.0000.3730.0000.6010.00010.3140.0000.0000.5220.00050.200

Sources: State Energy Data Report. Energy Information Administration, Washington, DC. Nebraska Department of Environment and Energy, Lincoln, NE.

Note: Totals may not equal the sum of the components due to independent rounding.