Nebraska's Total Energy Consumption by End-Use Sector

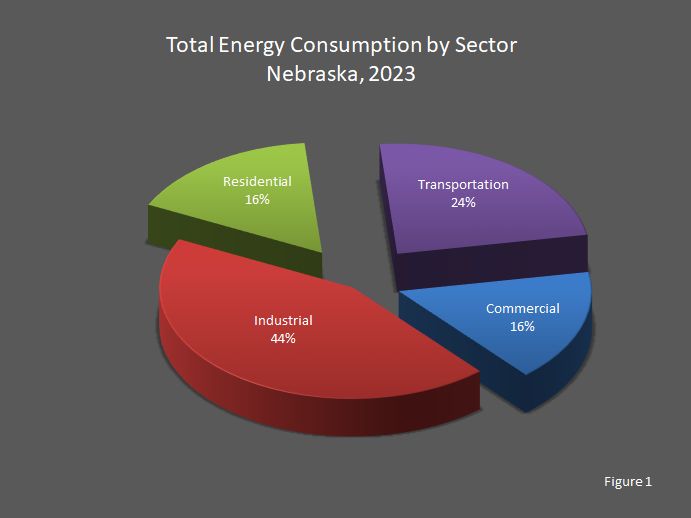
In 2021, the industrial sector consumed nearly half (45 percent) of Nebraska's total energy consumption. The other three end–use sectors comprised relatively equal portions of Nebraska's total energy consumption. Twenty–two (22) percent of the energy consumed in Nebraska was used in the transportation sector. The residential sector consumed 18 percent, and the commercial sector consumed 15 percent. This is reflected in Figure 1.

Between 2020 and 2021, the industrial sector's energy use increased 6.5 percent, the transportation sector's energy use increased 4.8 percent, and the commercial sector's energy use increased 1.2 percent. The residential sector's energy use decreased 0.5 percent.
 

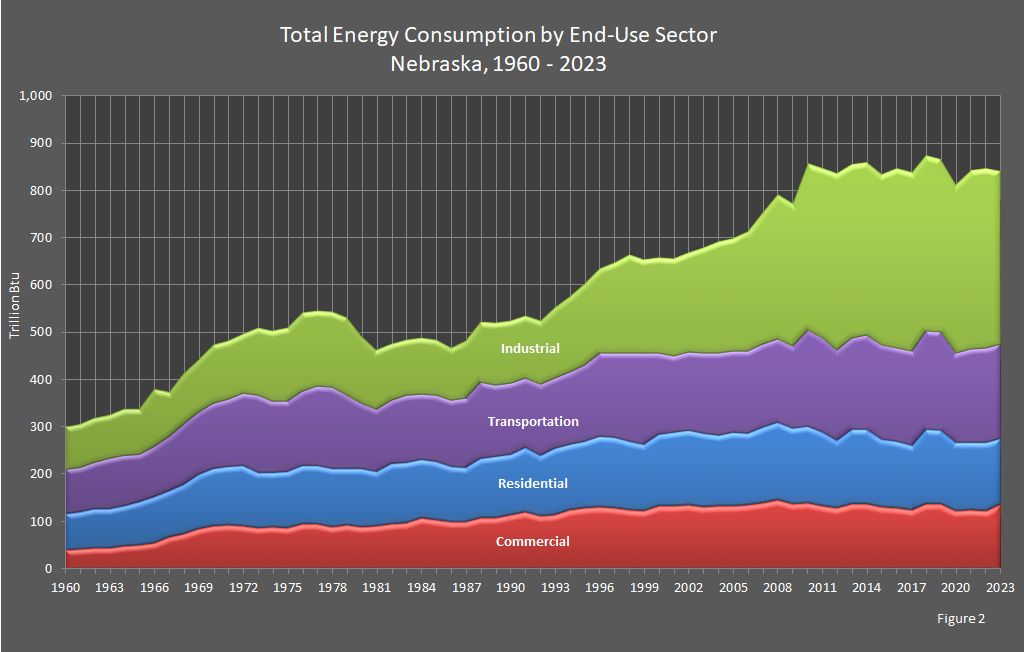
Total Energy Consumption by End-Use Sector 1960-2021 Graph


Total Energy Consumption by End–Use Sector Nebraska 2020 – 2021

[Trillion British Thermal Units (Btu)]

YearEnd–Use SectorsTotal
Energy
Consumption
CommercialIndustrialResidentialTransportation
2021138.6400.0159.3200.4898.0
2020137.0375.6160.1191.3863.5


Total Energy Consumption by End–Use Sector Nebraska 2000 – 2019

[Trillion British Thermal Units (Btu)]

YearEnd–Use SectorsTotal
Energy
Consumption
CommercialIndustrialResidentialTransportation
2019148.3380.9169.3208.8907.2
2018147.5380.3167.9207.2902.8
2017135.2392.4146.2202.3876.0
2016134.5384.6148.3200.9868.3
2015137.1368.1148.6200.1853.8
2014141.6363.8163.5201.2870.2
2013140.4374.9163.6193.8872.8
2012131.8382.1147.0192.5853.4
2011135.8368.1160.4198.9863.6
2010141.1351.7163.2205.0861.6
2009138.9304.6158.7176.7778.8
2008145.8308.3165.2176.0795.4
2007140.6280.4159.7176.3757.1
2006133.1252.8149.7174.3710.1
2005130.5237.2153.3172.6693.6
2004129.7235.1147.5173.7686.0
2003127.9221.3151.9172.4673.5
2002132.9209.2155.4167.1664.6
2001130.4206.3154.4162.4653.5
2000132.3202.8148.3172.5655.9


Total Energy Consumption by End–Use Sector Nebraska 1980 – 1999

[Trillion British Thermal Units (Btu)]

YearEnd–Use SectorsTotal
Energy
Consumption
CommercialIndustrialResidentialTransportation
1999120.5199.3140.3194.2654.2
1998123.1208.7143.3188.8664.1
1997128.6191.6146.4180.9647.5
1996129.6179.8148.1178.0634.4
1995126.8173.1139.7163.5603.0
1994123.5160.1137.3153.9574.7
1993111.8149.5139.2150.7551.2
1992110.5133.4125.4154.2523.4
1991118.7132.9134.8148.3534.7
1990112.7133.6127.2151.8525.3
1989112.8135.6132.2153.4533.9
1988111.5133.2129.2161.2535.1
1987102.0126.3119.4148.0495.7
1986102.9114.8123.3141.5482.5
1985108.4122.3128.1141.1499.9
1984112.0124.2128.9141.4506.5
1983100.8123.6134.1144.3502.8
198299.9124.6132.1135.5492.0
198194.5131.9119.4131.8477.6
198092.7147.5125.9141.0507.1


Total Energy Consumption by End–Use Sector Nebraska 1960 – 1979

[Trillion British Thermal Units (Btu)]

YearEnd–Use SectorsTotal
Energy
Consumption
CommercialIndustrialResidentialTransportation
197995.3169.0124.7156.1545.1
197892.2164.2127.3173.0556.7
197798.1164.6125.9168.4556.9
197698.5170.2128.0158.2554.8
197589.6160.5125.6149.9525.7
197492.1153.5119.7153.2518.5
197389.9146.5122.3163.5522.1
197295.1128.3130.5155.6509.5
197196.6127.7129.0142.8496.2
197093.4127.1127.7139.3487.5
196988.8116.4118.3132.4455.9
196876.1109.2107.7129.8422.8
196768.798.5101.6116.4385.2
196657.1123.0101.6107.7389.2
196552.398.595.7102.1348.6
196449.3101.589.2107.1347.1
196346.495.684.6108.3335.0
196245.095.385.9101.2327.4
196143.594.480.696.6314.9
196042.192.978.694.2307.8

Sources: State Energy Data Report. Energy Information Administration, Washington, DC. Nebraska Department of Environment and Energy, Lincoln, NE.

Note: Totals may not equal the sum of the components due to independent rounding.