Consumption in the Commercial Sector
The commercial sector consists of non-manufacturing business establishments. Included are hotels, motels, restaurants, wholesale businesses, retail stores, laundries, and other service enterprises; health, social, and educational institutions; and federal, state, and local governments. Streetlights, pumps, bridges, and public services are also included. Fuel used in motor vehicles for commercial purposes is included in the transportation sector. Examples of common uses of energy in the commercial sector include space heating, water heating, refrigeration, air conditioning, and cooking.
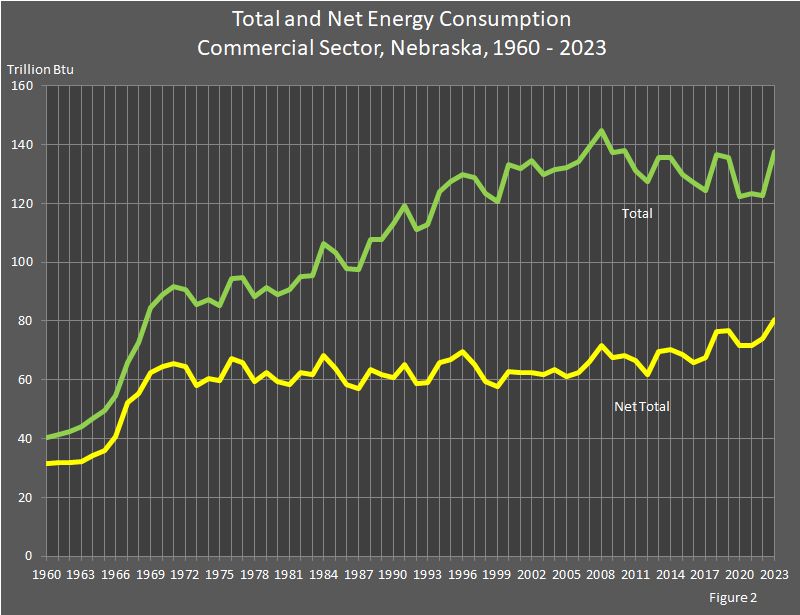
For the residential, commercial, and industrial sectors, a net total or net energy consumption (less electrical system energy losses) is provided to indicate the energy actually consumed by these sectors. In addition, energy consumed in the generation, transmission, and distribution of electricity (electrical system energy losses) is allocated to each sector based on the electricity consumed by the sector. Thus, total energy consumption represents the energy consumed by the sector as well as that used to provide electricity to the sector. (Figure 2)
From 2022 to 2023, commercial sector net energy use increased 8.8 percent to 80.4 trillion British thermal units (Btu). Total energy use in the sector increased 12 percent to 137.5 trillion Btu. Petroleum use decreased 14.1 percent from 2022. Electricity use increased 17.1 percent, natural gas use increased 4.7 percent, and renewable energy use increased 3.4 percent from 2022.
Residual fuel consumption was small enough to round to zero in this table for the years 1983–1986, 1996, 2002, 2007, 2010–2013, and 2015, and 2016. Coal consumption was small enough to round to zero in this table for the years 1998–2000, and 2008–2023.
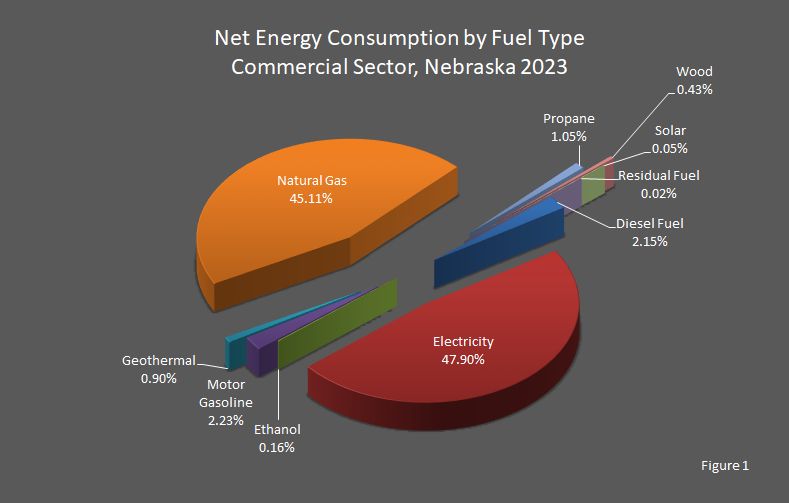
In 2023, nearly all (93.0 percent) of the commercial sector's energy needs were met by electricity and natural gas (Figure 1). Petroleum products made up 5.5 percent of the energy consumed in the commercial sector, and 1.5 percent was renewable energy.
| Attachment | Size |
|---|---|
| 2020 - 2023 | 43.25 KB |
| 2000 - 2019 | 46.2 KB |
| 1980 - 1999 | 46.3 KB |
| 1960 - 1979 | 46.23 KB |
Sources: State Energy Data Report. Energy Information Administration, Washington, DC. Nebraska Department of Environment and Energy, Lincoln, NE.
This report was updated on January 16, 2026.
Typically, there is a year between updates.