Consumption in the Transportation Sector
The transportation sector consists of private and public vehicles that move people and commodities. Included are automobiles, trucks, buses, motorcycles, railroads, aircraft, ships, barges, and natural gas pipelines. Natural gas use reflects the fuel needed to move natural gas through a pipeline to end users in the residential, commercial, industrial, and electric power sectors. Since 1990, natural gas consumption also includes natural gas consumed as vehicle fuel. Transportation is a challenge in Nebraska, the nation’s 17th-largest state; long distances between locations contribute to the energy demands in the transportation sector, accounting for 24% of Nebraska’s total energy demand in 2023.
Between 2022 and 2023, transportation sector energy use decreased less than one percent (0.72%) to 199.0 trillion British thermal units (Btu). Natural gas use decreased 8.2 percent, and petroleum use decreased less than one percent (0.90%) from 2022. Renewable energy use increased 8.4 percent. (Renewable energy consisted of ethanol and biodiesel.) If there was any consumption of coal, electricity, or residual fuel in 2023, the amounts were so small that the numbers rounded to zero.
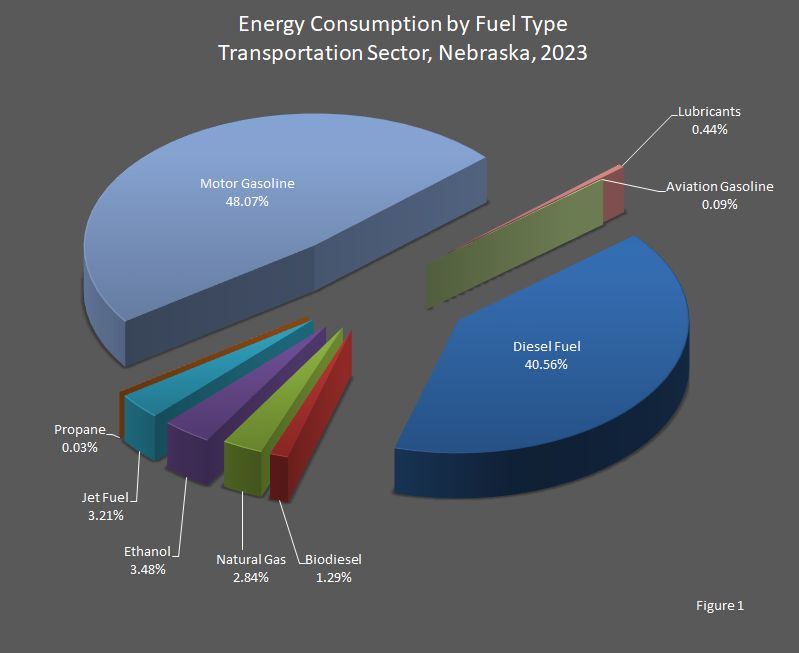
In 2023, nearly all of the transportation sector energy needs were met by petroleum products (92.4 percent)--primarily gasoline (48 percent) and diesel fuel (41 percent) (Figure 1). Renewable products met 4.8 percent of the energy consumed in the transportation sector--ethanol, 3.5 percent, and biodiesel, 1.3 percent. Natural gas met 2.8 percent.
In 2023, motor gasoline (52 percent), diesel fuel (44 percent), and jet fuel (3.5 percent) made up the majority of the petroleum products consumed by the transportation sector. Each of the rest of the petroleum products comprised one percent or less of total petroleum products.
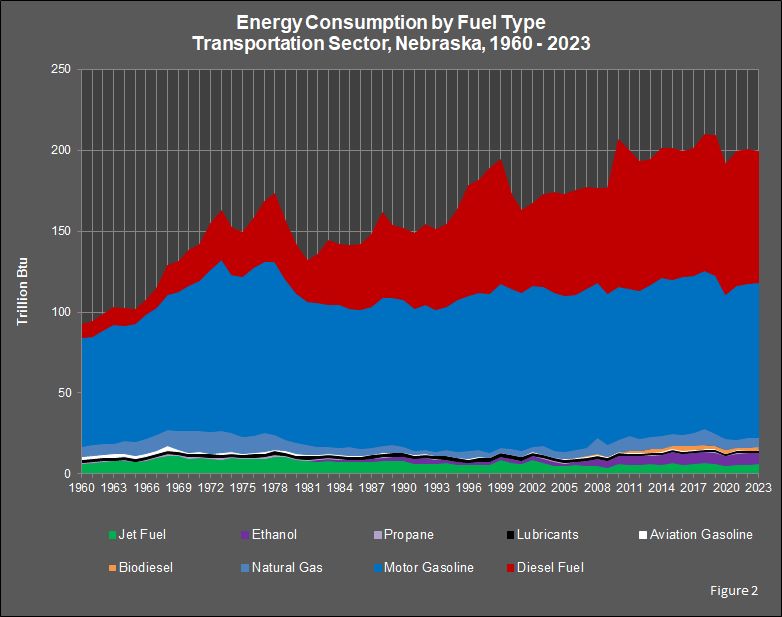
Trends in fuel types used in the transportation sector illustrate the static nature of this sector and how little modes of transportation have changed since record keeping began in 1960. The major overall changes over this period were increased fuel use, the growing share of diesel fuel, and the introduction and modest growth of biofuels. However, the expected growth in the use of battery-electric and plug-in hybrid vehicles over the next decade should add electricity as a major additional transportation energy source. In reviewing the transportation sector’s historical energy supply, it was nearly totally dependent on petroleum-based fuels in 1960 and remained just as dependent in 2023 (Figure 2).
| Attachment | Size |
|---|---|
| 2020 - 2023 | 54.97 KB |
| 2000 - 2019 | 57.54 KB |
| 1980 - 1999 | 57.54 KB |
| 1960 - 1979 | 57.68 KB |
Sources: State Energy Data Report. Energy Information Administration, Washington, DC. Nebraska Department of Water, Energy, and Environment, Lincoln, NE.
This report was updated on November 24, 2025.
Typically, there is a year between updates.