
Nebraska Average
Introduction
Freezing weather during the winter or sweltering weather during the summer can increase your utility bills. You can find out how much of the rise in cost is a result of the weather by using a unit of measure called the "degree day".
Degree days are used to estimate fuel consumption and to pinpoint the nominal annual heating and cooling loads of a building. A degree day is a 1 degree Fahrenheit difference between 65 degrees Fahrenheit and the average outdoor air temperature on a given day. The more extreme the temperature, the higher the number of degree days. Degree day measurements can be used to describe the effect of outdoor temperature on the amount of energy needed for space heating or cooling. Hot days, which could require the use of energy for cooling, are measured in cooling degree days. On a day with an average temperature of 90 degrees Fahrenheit, 25 cooling degree days would be recorded. Cold days are measured in heating degree days. For a day with an average temperature of 45 degrees Fahrenheit, 20 heating degree days would be recorded. Two such cold days would result in a total of 40 heating degree days for the two–day period.
By studying degree day patterns in an area, the increases or decreases in heating or air conditioning bills can be evaluated from year to year. The Nebraska Department of Environment and Energy maintains degree days and degree day normals for twelve cities around the state in addition to the state's degree days. Degree day information may also be published in a local newspaper, usually in the weather section. Information could be available from a local utility. Its public relations department may be able to provide the number of degree days in the last billing period and how it compares to the number of degree days in previous billing periods. The National Oceanic and Atmospheric Administration's National Centers for Environmental Information have webpages where you can find monthly degree days for any state, county, or station for no fee.
In the tables below, Nebraska's heating and cooling degree days are listed as well as degree day normals. Figures 1 and 3 compare over fifty years of degree days to the degree day normals, and Figures 2 and 4 compare the last two years of degree days to degree day normals for the state.
Degree Day Normals
Degree day normals are thirty–year averages over a baseline comparison period. The current thirty–year period used for degree–day normals is 1991–2020. The average number of heating and cooling degree days, or the degree day normals, for each month and a total for the year is listed in the first row of each table below.
Nebraska's heating degree day normal for a year is 6281 and the cooling degree day normal for a year is 996. In a year with normal weather, Nebraskans will heat their homes and businesses 6281 degree days and cool their homes and businesses 996 degree days. In comparison, Hawai'i's (a hot weather state) heating degree day normal is 1 and Hawai'i's cooling degree day normal is 4766, and Colorado's (a cold weather state) heating degree day normal is 7053 and Colorado's cooling degree day normal is 329.
In the 2023/2024 season, Nebraska's heating degree days totaled 5523 or 758 degree days less than the degree day normal. This indicates Nebraska's winter was 12 percent warmer than normal. (Nebraskans used less heating.) In 2024, Nebraska's cooling degree days totaled 1110 or 114 degree days more than the degree day normal. This indicates Nebraska's summer was 11 percent warmer than normal. (Nebraskans used more air conditioning.) Comparison can also be made between degree day normals and degree days using individual months.
Heating Degree Days
Heating degree days measure how cold Nebraska is over a period of time relative to a base temperature (most commonly 65 degrees Fahrenheit). Heating degree days are used as an indicator of space heating energy requirements.
According to Figure 1 and the data table below, in over fifty years, 2011/2012 was the warmest year with 5286 heating degree days, and 1978/1979 was the coldest year with 7440 heating degree days. Figure 1 compares Nebraska's heating degree days each year (the red line) to what is considered normal (the orange line).
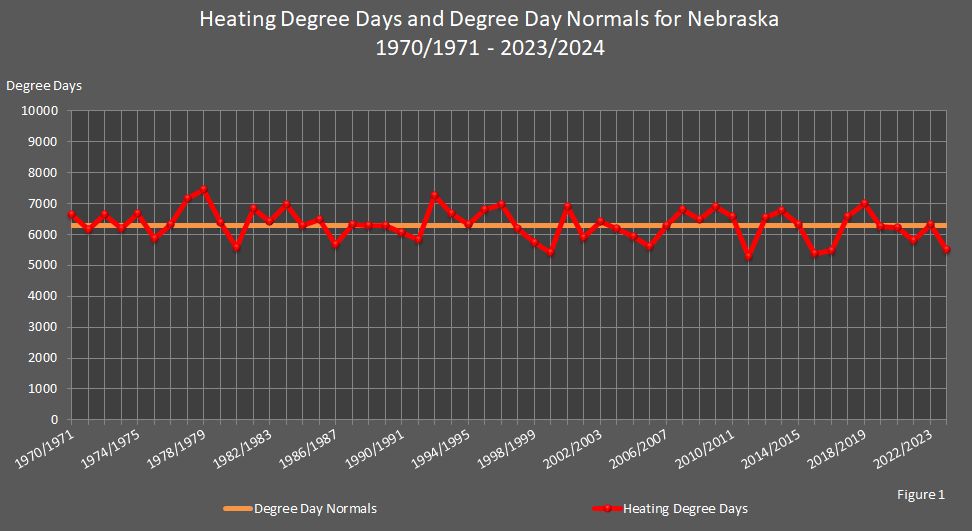
Figure 2 compares heating degree days with the degree day normals for each month during the most recent year that data is available and the prior year. Heating degree days are usually found during the heating season, or winter, but there can be heating degree days during the fall and spring, too. Zero (0) heating degree days for any month indicate that temperatures reached levels that homes and businesses required minimal or no heating.
In 2023/2024, the heating degree days reported for March through November were close to the heating degree day normals for each month. January, February, and December were exceptions (see the next paragraph). The total heating degree days for 2023/2024 indicated 12 percent warmer–than–normal weather. The previous year, 2022/2023, had relatively the same weather as 2023/2024 from April to October but had a colder winter (November through March).
In 2023/2024, January was 11 percent colder than normal (requiring more heating) with 1406 heating degree days versus 1267 heating degree day normals. February was 29 percent warmer than normal, and December was 18 percent warmer than normal (requiring less heating).
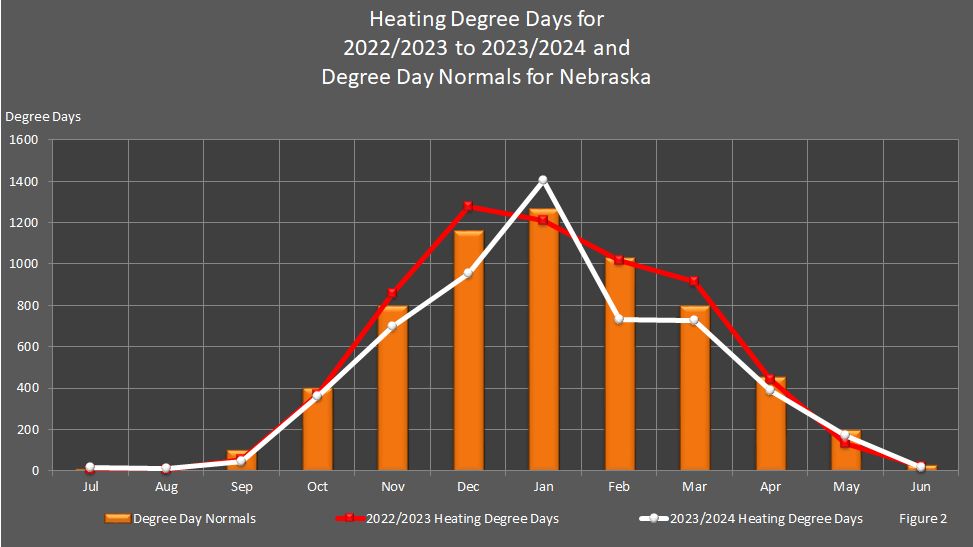
December and January are normally the peak of winter in Nebraska. In other words, December and January usually have the most heating degree days. They are the coldest months of the year and require the most days of heating. This is true for the winters of 2023/2024 and 2022/2023, as observed in Figure 2.
Data in the table below shows that the number of heating degree days, for example, in January 2024 (1406) was 139 degree days above the heating degree day normal (1267). In other words, the weather was colder than usual, and Nebraska consumers heated their homes and businesses 11 percent more than they would in a January with normal winter weather.
Heating Degree Days and Degree Day Normals for Nebraska
1969/1970 – 2024/2025
| Season | Jul | Aug | Sep | Oct | Nov | Dec | Jan | Feb | Mar | Apr | May | Jun | Total |
|---|---|---|---|---|---|---|---|---|---|---|---|---|---|
| Normal | 11 | 16 | 102 | 404 | 800 | 1163 | 1267 | 1030 | 797 | 458 | 200 | 33 | 6281 |
| 2024/2025 | 13 | 13 | 46 | 241 | 707 | 1029 | 1312 | 1194 | 624 | NA | NA | NA | NA |
| 2023/2024 | 14 | 9 | 46 | 359 | 698 | 953 | 1406 | 734 | 729 | 389 | 169 | 17 | 5523 |
| 2022/2023 | 6 | 7 | 54 | 367 | 859 | 1277 | 1206 | 1015 | 913 | 435 | 128 | 22 | 6309 |
| 2021/2022 | 9 | 7 | 52 | 322 | 655 | 943 | 1266 | 1060 | 795 | 503 | 184 | 17 | 5813 |
| 2020/2021 | 7 | 10 | 122 | 525 | 645 | 1068 | 1118 | 1391 | 637 | 462 | 207 | 12 | 6204 |
| 2019/2020 | 8 | 17 | 35 | 567 | 871 | 1059 | 1211 | 979 | 717 | 515 | 247 | 10 | 6236 |
| 2018/2019 | 12 | 18 | 71 | 503 | 957 | 1126 | 1233 | 1344 | 999 | 417 | 284 | 36 | 7000 |
| 2017/2018 | 5 | 37 | 71 | 379 | 759 | 1177 | 1333 | 1205 | 797 | 688 | 95 | 13 | 6559 |
| 2016/2017 | 4 | 1 | 35 | 232 | 599 | 1225 | 1199 | 789 | 713 | 428 | 220 | 19 | 5464 |
| 2015/2016 | 4 | 13 | 31 | 308 | 672 | 1030 | 1235 | 890 | 620 | 397 | 188 | 1 | 5389 |
| 2014/2015 | 26 | 15 | 120 | 344 | 968 | 1103 | 1180 | 1178 | 702 | 396 | 237 | 30 | 6299 |
| 2013/2014 | 13 | 10 | 45 | 432 | 848 | 1314 | 1291 | 1219 | 916 | 451 | 188 | 33 | 6761 |
| 2012/2013 | 0 | 13 | 105 | 486 | 723 | 1143 | 1234 | 1010 | 953 | 617 | 210 | 34 | 6528 |
| 2011/2012 | 0 | 11 | 167 | 336 | 771 | 1111 | 1060 | 988 | 406 | 307 | 115 | 14 | 5286 |
| 2010/2011 | 8 | 6 | 98 | 313 | 803 | 1239 | 1441 | 1100 | 839 | 466 | 226 | 35 | 6574 |
| 2009/2010 | 30 | 30 | 134 | 640 | 639 | 1421 | 1433 | 1206 | 773 | 330 | 236 | 25 | 6897 |
| 2008/2009 | 8 | 18 | 122 | 407 | 772 | 1354 | 1277 | 941 | 834 | 518 | 182 | 47 | 6480 |
| 2007/2008 | 6 | 2 | 90 | 310 | 760 | 1338 | 1386 | 1154 | 872 | 593 | 245 | 36 | 6792 |
| 2006/2007 | 0 | 12 | 172 | 482 | 781 | 1033 | 1330 | 1208 | 612 | 509 | 124 | 30 | 6293 |
| 2005/2006 | 1 | 13 | 47 | 356 | 698 | 1255 | 882 | 1018 | 845 | 316 | 151 | 16 | 5598 |
| 2004/2005 | 20 | 38 | 52 | 357 | 736 | 1086 | 1360 | 879 | 782 | 385 | 199 | 21 | 5915 |
| 2003/2004 | 5 | 5 | 150 | 320 | 866 | 1065 | 1338 | 1135 | 677 | 391 | 163 | 64 | 6179 |
| 2002/2003 | 0 | 11 | 81 | 586 | 840 | 1035 | 1249 | 1133 | 803 | 391 | 234 | 56 | 6419 |
| 2001/2002 | 1 | 9 | 109 | 398 | 540 | 1041 | 1094 | 981 | 1062 | 405 | 244 | 8 | 5892 |
| 2000/2001 | 8 | 1 | 80 | 325 | 1038 | 1505 | 1206 | 1226 | 933 | 375 | 165 | 37 | 6899 |
| 1999/2000 | 0 | 18 | 140 | 393 | 565 | 1021 | 1143 | 833 | 686 | 439 | 128 | 40 | 5406 |
| 1998/1999 | 5 | 9 | 32 | 343 | 690 | 1075 | 1267 | 806 | 806 | 464 | 193 | 51 | 5741 |
| 1997/1998 | 6 | 19 | 78 | 371 | 888 | 1098 | 1220 | 822 | 1031 | 470 | 119 | 61 | 6183 |
| 1996/1997 | 17 | 21 | 148 | 379 | 1013 | 1329 | 1386 | 1001 | 743 | 616 | 281 | 26 | 6960 |
| 1995/1996 | 3 | 1 | 135 | 412 | 889 | 1149 | 1432 | 994 | 1030 | 490 | 248 | 26 | 6809 |
| 1994/1995 | 21 | 19 | 83 | 343 | 751 | 1131 | 1284 | 894 | 833 | 571 | 324 | 45 | 6299 |
| 1993/1994 | 15 | 15 | 202 | 449 | 944 | 1083 | 1390 | 1241 | 731 | 457 | 139 | 18 | 6684 |
| 1992/1993 | 36 | 52 | 118 | 402 | 946 | 1231 | 1458 | 1267 | 922 | 548 | 217 | 62 | 7259 |
| 1991/1992 | 7 | 11 | 90 | 435 | 1043 | 1033 | 1009 | 790 | 696 | 473 | 182 | 68 | 5837 |
| 1990/1991 | 12 | 10 | 51 | 402 | 697 | 1347 | 1449 | 816 | 736 | 379 | 132 | 15 | 6046 |
| 1989/1990 | 2 | 14 | 140 | 376 | 835 | 1432 | 1008 | 974 | 751 | 465 | 257 | 19 | 6273 |
| 1988/1989 | 7 | 2 | 91 | 485 | 766 | 1054 | 1034 | 1350 | 892 | 357 | 184 | 58 | 6280 |
| 1987/1988 | 1 | 24 | 111 | 518 | 695 | 1080 | 1433 | 1120 | 772 | 451 | 107 | 4 | 6316 |
| 1986/1987 | 1 | 33 | 86 | 401 | 901 | 1090 | 1109 | 795 | 785 | 346 | 106 | 17 | 5670 |
| 1985/1986 | 8 | 31 | 142 | 415 | 1117 | 1411 | 1021 | 1089 | 645 | 398 | 174 | 15 | 6466 |
| 1984/1985 | 8 | 1 | 146 | 416 | 770 | 1175 | 1407 | 1154 | 701 | 326 | 129 | 56 | 6289 |
| 1983/1984 | 1 | 0 | 64 | 370 | 785 | 1758 | 1304 | 869 | 1009 | 558 | 227 | 26 | 6971 |
| 1982/1983 | 2 | 14 | 117 | 384 | 879 | 1090 | 1182 | 928 | 842 | 634 | 278 | 46 | 6396 |
| 1981/1982 | 6 | 21 | 94 | 444 | 693 | 1212 | 1593 | 1123 | 885 | 516 | 174 | 85 | 6846 |
| 1980/1981 | 0 | 6 | 73 | 426 | 696 | 1089 | 1118 | 947 | 720 | 229 | 237 | 19 | 5560 |
| 1979/1980 | 11 | 14 | 63 | 366 | 906 | 1000 | 1279 | 1164 | 954 | 418 | 178 | 19 | 6372 |
| 1978/1979 | 6 | 13 | 48 | 398 | 865 | 1364 | 1738 | 1390 | 865 | 491 | 228 | 34 | 7440 |
| 1977/1978 | 0 | 24 | 81 | 398 | 811 | 1226 | 1651 | 1394 | 931 | 425 | 204 | 26 | 7171 |
| 1976/1977 | 1 | 8 | 91 | 532 | 961 | 1197 | 1541 | 886 | 710 | 286 | 85 | 16 | 6314 |
| 1975/1976 | 1 | 2 | 155 | 302 | 811 | 1125 | 1261 | 784 | 817 | 349 | 226 | 31 | 5864 |
| 1974/1975 | 0 | 34 | 168 | 312 | 769 | 1157 | 1273 | 1203 | 1030 | 528 | 151 | 44 | 6669 |
| 1973/1974 | 9 | 0 | 141 | 299 | 801 | 1266 | 1441 | 928 | 709 | 386 | 160 | 42 | 6182 |
| 1972/1973 | 13 | 16 | 105 | 487 | 896 | 1370 | 1280 | 1007 | 712 | 481 | 232 | 25 | 6624 |
| 1971/1972 | 18 | 10 | 100 | 303 | 760 | 1136 | 1362 | 1058 | 725 | 460 | 187 | 26 | 6145 |
| 1970/1971 | 1 | 4 | 108 | 479 | 847 | 1129 | 1400 | 1109 | 906 | 397 | 241 | 13 | 6634 |
| 1969/1970 | 8 | 10 | 88 | 573 | 783 | 1244 | 1467 | 912 | 972 | 444 | 108 | 24 | 6633 |
Cooling Degree Days
Cooling degree days measure how warm Nebraska is over a period of time relative to a base temperature (most commonly 65 degrees Fahrenheit). Cooling degree days are used as an indicator of air conditioning energy requirements.
According to Figure 3 and the data table below, in over fifty years, 2012 was the hottest year with 1306 cooling degree days, and 1992 was the coolest year with only 628 cooling degree days. Figure 3 compares Nebraska's cooling degree days each year (the blue line) to what is considered normal (the lighter blue line).
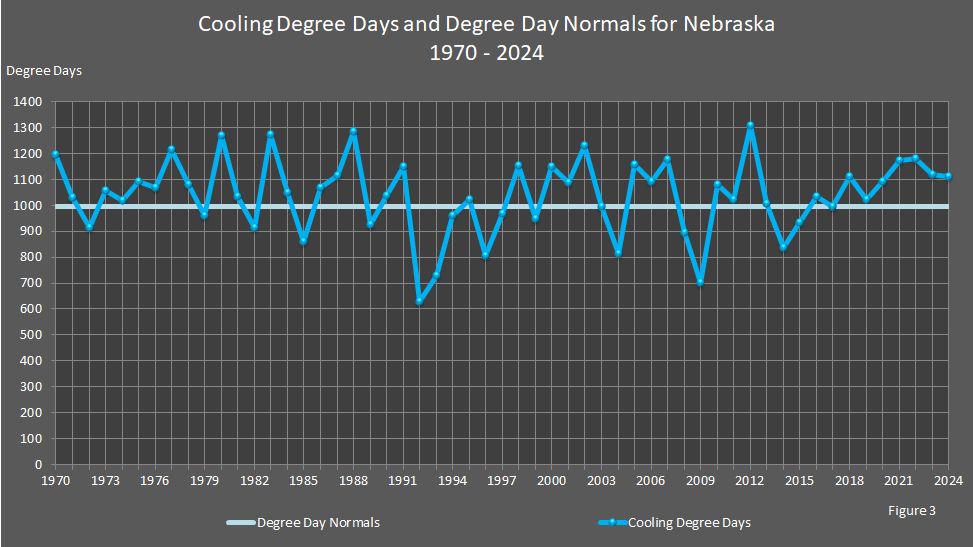
Figure 4 compares cooling degree days with the degree day normals for each month during the most recent year that data is available and the prior year. Cooling degree days are usually found during the cooling season, or summer, but there can be cooling degree days during the fall and spring, too. With the exception of January 2006 and February 2024, the period from November to February of each year consistently has zero (0) cooling degree days in Nebraska. Zero (0) degree days for any month indicate that temperatures reached levels that homes and businesses required minimal or no cooling.
In 2024, the cooling degree days reported for January through May, August, and October through December were relatively the same as the cooling degree day normals. The exceptions were June, July, and September. The cooling degree days reported for June were 21 percent above the cooling degree day normal (the month was 21 percent warmer than normal). July's cooling degree days were 13 percent below normal, and September's cooling degree days were 60 percent above normal. It shows in the data table that the total for 2024 was 11 percent above the degree day normal so 2024 had warmer–than–normal weather. The previous year, 2023, was relatively the same as 2024 from month to month and for the entire year.
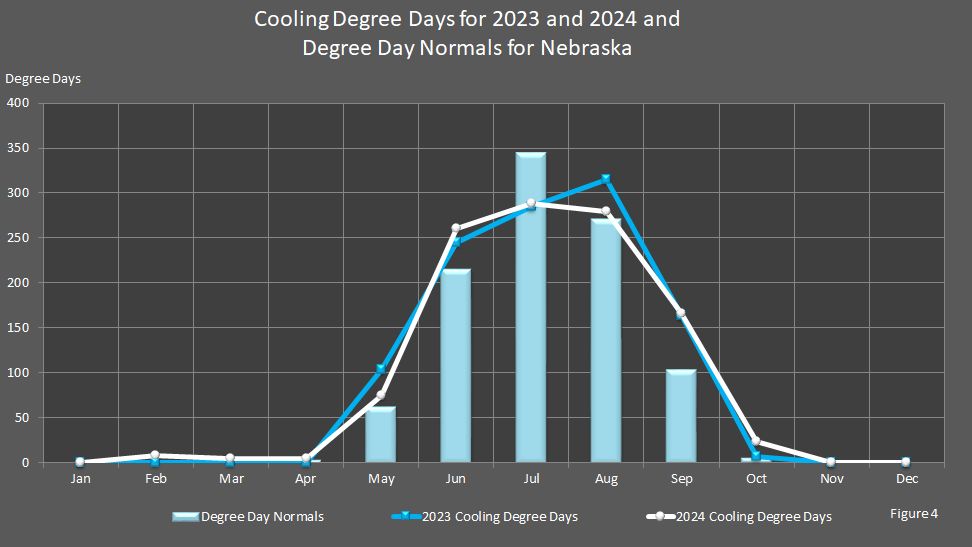
July is normally the peak of summer in Nebraska. In other words, July usually has the most cooling degree days. In 2023 and 2024, Nebraska had the most cooling degree days in August and July, respectively, as observed in Figure 4.
Data in the table below shows that the number of cooling degree days, for example, in July 2024 (288) was 44 degree days below the cooling degree day normal (332). In other words, the weather was cooler than usual, and Nebraska consumers cooled their homes and businesses 13 percent less than they would in a July with normal summer weather.
Cooling Degree Days and Degree Day Normals for Nebraska
1970 – 2025
| Year | Jan | Feb | Mar | Apr | May | Jun | Jul | Aug | Sep | Oct | Nov | Dec | Total |
|---|---|---|---|---|---|---|---|---|---|---|---|---|---|
| Normal | 0 | 0 | 3 | 3 | 63 | 215 | 332 | 270 | 104 | 6 | 0 | 0 | 996 |
| 2025 | 0 | 0 | 11 | NA | NA | NA | NA | NA | NA | NA | NA | NA | NA |
| 2024 | 0 | 8 | 5 | 5 | 75 | 260 | 288 | 279 | 166 | 24 | 0 | 0 | 1110 |
| 2023 | 0 | 0 | 0 | 0 | 104 | 245 | 285 | 315 | 164 | 7 | 0 | 0 | 1120 |
| 2022 | 0 | 0 | 0 | 0 | 66 | 265 | 366 | 325 | 153 | 6 | 0 | 0 | 1181 |
| 2021 | 0 | 0 | 9 | 0 | 51 | 293 | 324 | 329 | 156 | 11 | 0 | 0 | 1173 |
| 2020 | 0 | 0 | 5 | 0 | 35 | 327 | 353 | 295 | 77 | 0 | 0 | 0 | 1092 |
| 2019 | 0 | 0 | 0 | 5 | 28 | 194 | 348 | 247 | 200 | 0 | 0 | 0 | 1022 |
| 2018 | 0 | 0 | 0 | 0 | 142 | 296 | 299 | 244 | 129 | 0 | 0 | 0 | 1110 |
| 2017 | 0 | 0 | 0 | 2 | 47 | 253 | 380 | 175 | 131 | 6 | 0 | 0 | 994 |
| 2016 | 0 | 0 | 0 | 1 | 28 | 312 | 314 | 246 | 126 | 6 | 0 | 0 | 1033 |
| 2015 | 0 | 0 | 5 | 6 | 40 | 202 | 299 | 205 | 167 | 10 | 0 | 0 | 934 |
| 2014 | 0 | 0 | 0 | 0 | 63 | 202 | 221 | 263 | 78 | 9 | 0 | 0 | 836 |
| 2013 | 0 | 0 | 0 | 0 | 48 | 193 | 291 | 299 | 170 | 4 | 0 | 0 | 1005 |
| 2012 | 0 | 0 | 38 | 13 | 122 | 273 | 500 | 269 | 91 | 0 | 0 | 0 | 1306 |
| 2011 | 0 | 0 | 0 | 0 | 46 | 196 | 438 | 289 | 45 | 9 | 0 | 0 | 1023 |
| 2010 | 0 | 0 | 0 | 12 | 40 | 227 | 339 | 351 | 99 | 12 | 0 | 0 | 1080 |
| 2009 | 0 | 0 | 0 | 0 | 65 | 168 | 209 | 193 | 67 | 0 | 0 | 0 | 702 |
| 2008 | 0 | 0 | 0 | 0 | 36 | 192 | 339 | 244 | 78 | 5 | 0 | 0 | 894 |
| 2007 | 0 | 0 | 10 | 0 | 110 | 204 | 365 | 369 | 106 | 13 | 0 | 0 | 1177 |
| 2006 | 1 | 0 | 0 | 12 | 87 | 259 | 405 | 284 | 44 | 0 | 0 | 0 | 1092 |
| 2005 | 0 | 0 | 0 | 7 | 57 | 253 | 381 | 284 | 166 | 8 | 0 | 0 | 1156 |
| 2004 | 0 | 0 | 6 | 5 | 77 | 135 | 246 | 177 | 159 | 7 | 0 | 0 | 812 |
| 2003 | 0 | 0 | 0 | 5 | 38 | 146 | 382 | 359 | 56 | 11 | 0 | 0 | 997 |
| 2002 | 0 | 0 | 0 | 4 | 36 | 332 | 446 | 296 | 117 | 0 | 0 | 0 | 1231 |
| 2001 | 0 | 0 | 0 | 7 | 79 | 189 | 404 | 317 | 87 | 5 | 0 | 0 | 1088 |
| 2000 | 0 | 0 | 6 | 0 | 109 | 187 | 331 | 381 | 119 | 16 | 0 | 0 | 1149 |
| 1999 | 0 | 0 | 0 | 0 | 60 | 162 | 409 | 245 | 64 | 8 | 0 | 0 | 948 |
| 1998 | 0 | 0 | 0 | 0 | 117 | 150 | 361 | 310 | 201 | 14 | 0 | 0 | 1153 |
| 1997 | 0 | 0 | 0 | 0 | 26 | 229 | 345 | 238 | 120 | 10 | 0 | 0 | 968 |
| 1996 | 0 | 0 | 0 | 0 | 35 | 225 | 253 | 226 | 57 | 10 | 0 | 0 | 806 |
| 1995 | 0 | 0 | 0 | 0 | 19 | 177 | 356 | 396 | 67 | 7 | 0 | 0 | 1022 |
| 1994 | 0 | 0 | 0 | 0 | 95 | 260 | 235 | 243 | 113 | 13 | 0 | 0 | 959 |
| 1993 | 0 | 0 | 0 | 0 | 45 | 139 | 258 | 259 | 29 | 0 | 0 | 0 | 730 |
| 1992 | 0 | 0 | 6 | 0 | 63 | 136 | 190 | 144 | 82 | 7 | 0 | 0 | 628 |
| 1991 | 0 | 0 | 0 | 7 | 106 | 291 | 340 | 291 | 108 | 5 | 0 | 0 | 1148 |
| 1990 | 0 | 0 | 0 | 0 | 32 | 255 | 292 | 293 | 158 | 7 | 0 | 0 | 1037 |
| 1989 | 0 | 0 | 0 | 8 | 64 | 151 | 362 | 269 | 62 | 10 | 0 | 0 | 926 |
| 1988 | 0 | 0 | 0 | 0 | 132 | 356 | 336 | 352 | 109 | 0 | 0 | 0 | 1285 |
| 1987 | 0 | 0 | 0 | 9 | 129 | 281 | 391 | 217 | 88 | 0 | 0 | 0 | 1115 |
| 1986 | 0 | 0 | 8 | 5 | 73 | 286 | 382 | 190 | 116 | 7 | 0 | 0 | 1067 |
| 1985 | 0 | 0 | 6 | 11 | 104 | 153 | 323 | 192 | 63 | 7 | 0 | 0 | 859 |
| 1984 | 0 | 0 | 0 | 0 | 41 | 238 | 336 | 367 | 62 | 7 | 0 | 0 | 1051 |
| 1983 | 0 | 0 | 0 | 0 | 28 | 176 | 426 | 493 | 140 | 11 | 0 | 0 | 1274 |
| 1982 | 0 | 0 | 0 | 0 | 74 | 116 | 370 | 265 | 81 | 10 | 0 | 0 | 916 |
| 1981 | 0 | 0 | 5 | 30 | 40 | 268 | 352 | 230 | 103 | 5 | 0 | 0 | 1033 |
| 1980 | 0 | 0 | 0 | 1 | 70 | 257 | 458 | 351 | 127 | 6 | 0 | 0 | 1270 |
| 1979 | 0 | 0 | 0 | 0 | 44 | 202 | 294 | 271 | 139 | 10 | 0 | 0 | 960 |
| 1978 | 0 | 0 | 0 | 1 | 53 | 230 | 346 | 279 | 165 | 7 | 0 | 0 | 1081 |
| 1977 | 0 | 0 | 6 | 17 | 153 | 273 | 422 | 220 | 116 | 7 | 0 | 0 | 1214 |
| 1976 | 0 | 0 | 0 | 9 | 43 | 212 | 372 | 325 | 107 | 0 | 0 | 0 | 1068 |
| 1975 | 0 | 0 | 0 | 0 | 93 | 180 | 373 | 371 | 53 | 20 | 0 | 0 | 1090 |
| 1974 | 0 | 0 | 5 | 6 | 81 | 180 | 497 | 185 | 46 | 17 | 0 | 0 | 1017 |
| 1973 | 0 | 0 | 5 | 0 | 41 | 240 | 316 | 369 | 65 | 20 | 0 | 0 | 1056 |
| 1972 | 0 | 0 | 1 | 0 | 62 | 226 | 280 | 254 | 93 | 0 | 0 | 0 | 916 |
| 1971 | 0 | 0 | 0 | 6 | 38 | 314 | 253 | 297 | 102 | 21 | 0 | 0 | 1031 |
| 1970 | 0 | 0 | 0 | 0 | 129 | 242 | 372 | 359 | 91 | 4 | 0 | 0 | 1197 |
Conclusion
An increase on your utility bill could be related to an increase in degree days but, if you decide that weather had no bearing on the increase in your utility bill, other factors worth considering are changes in demand, changes in your building's structure, changes in the number of occupants, or changes in fuel prices.
Sources: State Monthly Degree Days. NOAA National Centers for Environmental information, Climate at a Glance: Statewide Time Series, published April 2025, retrieved on April 11, 2025 from https://www.ncei.noaa.gov/access/monitoring/climate-at-a-glance/statewide/time-series.
State Degree Day Normals (1991–2020). High Plains Climate Center, University of Nebraska–Lincoln, Institute of Agriculture and Natural Resources, Lincoln, NE.
Nebraska Department of Environment and Energy, Lincoln, NE.
Note: NA = Not Available.