Percent of Income Spent on Energy
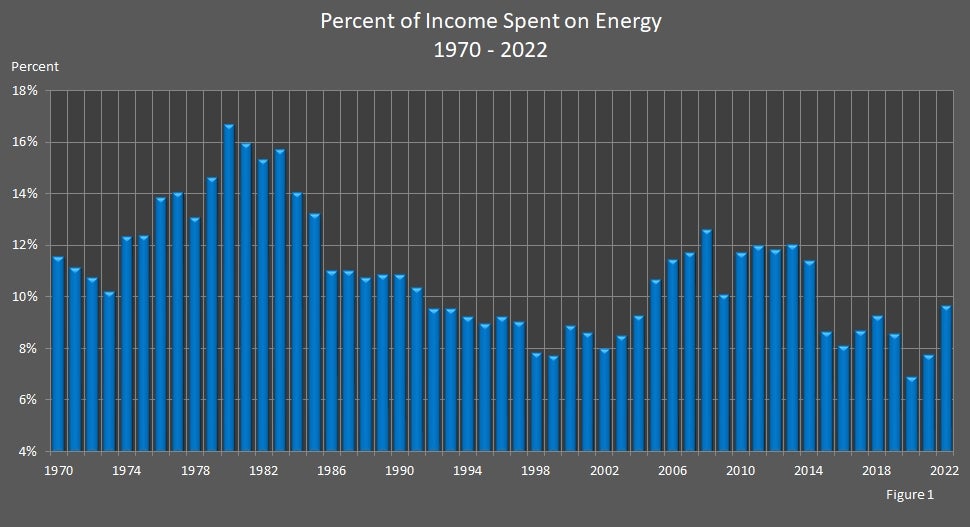
Nebraskans spent more than eighteen times as much on energy in 2022 as was spent in 1970. But consumers spent a lot less of their personal income on energy in 2022 than what they spent on energy in 1970. In 2022, energy bills accounted for only 9.6 percent of income, whereas energy bills accounted for 11.5 percent of income in 1970.
Looking at Figure 1 and the data table, before the oil embargo of 1973–74, annual energy expenditures were roughly an 11–percent share of personal income. During the price shocks of the 1970s and early 1980s, energy's share of income rose to a peak at 16.6 percent. The lowest percentage was 6.9 percent in 2020, probably due to COVID and lower transportation fuel consumption.

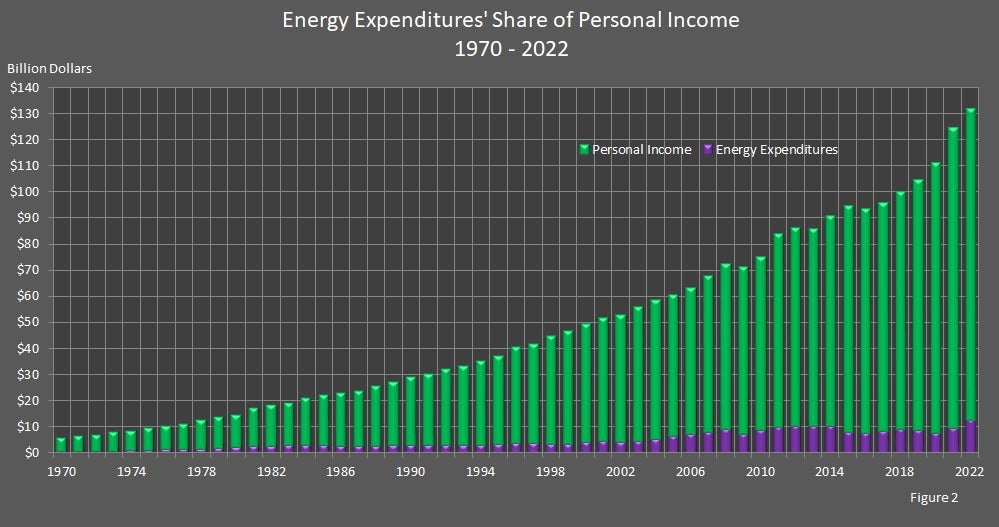
Figure 2 provides a bigger picture of the years under review. The bar chart shows energy expenditures as a part of personal income.

Energy Expenditures as a Percent of
Nebraska's Personal Income
2010 – 2022
| Year | Nebraska's Total Energy Expenditures (Nominal Dollars) | Nebraska's Total Personal Income (Nominal Dollars) | Nebraska's Energy Expenditures as a Percent of Personal Income |
|---|---|---|---|
| 2022 | $12,714,300,000 | $131,988,800,000 | 9.6% |
| 2021 | $9,665,800,000 | $121,934,700,000 | 7.9% |
| 2020 | $7,637,000,000 | $111,545,000,000 | 6.8% |
| 2019 | $8,895,300,000 | $104,430,200,000 | 8.5% |
| 2018 | $9,210,700,000 | $101,204,200,000 | 9.1% |
| 2017 | $8,261,500,000 | $97,112,000,000 | 8.5% |
| 2016 | $7,557,400,000 | $94,838,000,000 | 8.0% |
| 2015 | $8,165,700,000 | $96,282,100,000 | 8.5% |
| 2014 | $10,356,700,000 | $92,524,000,000 | 11.2% |
| 2013 | $10,319,300,000 | $87,398,700,000 | 11.8% |
| 2012 | $10,170,800,000 | $86,754,200,000 | 11.7% |
| 2011 | $10,040,900,000 | $84,211,600,000 | 11.9% |
| 2010 | $8,788,100,000 | $75,489,600,000 | 11.6% |
Energy Expenditures as a Percent of
Nebraska's Personal Income
1990 – 2009
| Year | Nebraska's Total Energy Expenditures (Nominal Dollars) | Nebraska's Total Personal Income (Nominal Dollars) | Nebraska's Energy Expenditures as a Percent of Personal Income |
|---|---|---|---|
| 2009 | $7,189,600,000 | $71,664,200,000 | 10.0% |
| 2008 | $9,103,000,000 | $72,815,500,000 | 12.5% |
| 2007 | $7,956,600,000 | $68,718,000,000 | 11.6% |
| 2006 | $7,216,700,000 | $63,850,600,000 | 11.3% |
| 2005 | $6,448,000,000 | $61,063,500,000 | 10.6% |
| 2004 | $5,404,900,000 | $58,826,400,000 | 9.2% |
| 2003 | $4,745,300,000 | $56,241,300,000 | 8.4% |
| 2002 | $4,197,600,000 | $52,884,600,000 | 7.9% |
| 2001 | $4,454,400,000 | $52,068,700,000 | 8.6% |
| 2000 | $4,382,100,000 | $49,767,700,000 | 8.8% |
| 1999 | $3,601,300,000 | $46,958,300,000 | 7.7% |
| 1998 | $3,496,700,000 | $44,804,800,000 | 7.8% |
| 1997 | $3,776,400,000 | $42,017,500,000 | 9.0% |
| 1996 | $3,735,800,000 | $40,790,100,000 | 9.2% |
| 1995 | $3,338,500,000 | $37,436,400,000 | 8.9% |
| 1994 | $3,249,700,000 | $35,731,200,000 | 9.1% |
| 1993 | $3,161,700,000 | $33,288,500,000 | 9.5% |
| 1992 | $3,063,600,000 | $32,208,400,000 | 9.5% |
| 1991 | $3,131,900,000 | $30,304,900,000 | 10.3% |
| 1990 | $3,163,900,000 | $29,240,300,000 | 10.8% |
Energy Expenditures as a Percent of
Nebraska's Personal Income
1970 – 1989
| Year | Nebraska's Total Energy Expenditures (Nominal Dollars) | Nebraska's Total Personal Income (Nominal Dollars) | Nebraska's Energy Expenditures as a Percent of Personal Income |
|---|---|---|---|
| 1989 | $2,948,800,000 | $27,305,500,000 | 10.8% |
| 1988 | $2,755,600,000 | $25,727,200,000 | 10.7% |
| 1987 | $2,629,700,000 | $24,065,800,000 | 10.9% |
| 1986 | $2,528,000,000 | $22,999,500,000 | 11.0% |
| 1985 | $2,948,100,000 | $22,348,400,000 | 13.2% |
| 1984 | $2,970,500,000 | $21,214,700,000 | 14.0% |
| 1983 | $2,991,100,000 | $19,046,700,000 | 15.7% |
| 1982 | $2,811,700,000 | $18,420,700,000 | 15.3% |
| 1981 | $2,726,800,000 | $17,140,500,000 | 15.9% |
| 1980 | $2,456,300,000 | $14,758,200,000 | 16.6% |
| 1979 | $2,019,600,000 | $13,834,200,000 | 14.6% |
| 1978 | $1,669,500,000 | $12,840,900,000 | 13.0% |
| 1977 | $1,551,800,000 | $11,073,100,000 | 14.0% |
| 1976 | $1,410,400,000 | $10,217,400,000 | 13.8% |
| 1975 | $1,204,900,000 | $9,766,400,000 | 12.3% |
| 1974 | $1,054,800,000 | $8,565,100,000 | 12.3% |
| 1973 | $835,600,000 | $8,225,700,000 | 10.2% |
| 1972 | $754,600,000 | $7,052,500,000 | 10.7% |
| 1971 | $707,200,000 | $6,368,800,000 | 11.1% |
| 1970 | $667,800,000 | $5,798,400,000 | 11.5% |
Sources: State Energy Price and Expenditure Report. Energy Information Administration, Washington, DC. State Personal Income. Bureau of Economic Analysis, Washington, DC. Nebraska Department of Water, Energy, and Environment, Lincoln, NE.
