Expenditures per Capita
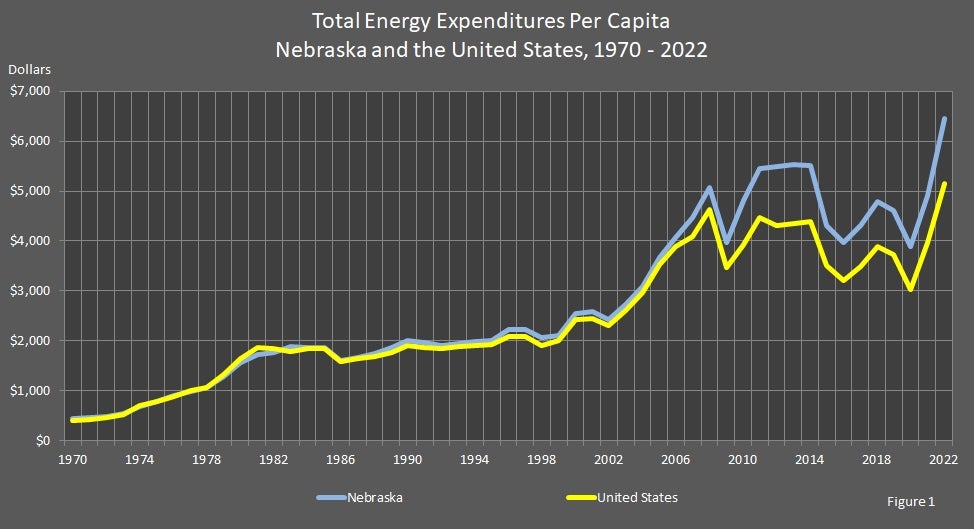
Energy expenditures per capita in Nebraska increased $1,547.6 (31.5 percent) from $4,912.70 in 2021 to $6,460.30 in 2022. Expenditures per capita in Nebraska for the year 2022 were 25 percent higher than the nation's expenditures per capita of $5,159.30.
In 2022, Nebraska spent $12.7 billion on energy which was less than one percent (0.74 percent) of the United States' energy expenditures.

Total Energy Expenditures Per Capita
Nebraska and the United States
2010 – 2022
| Year | Nebraska | United States | ||
|---|---|---|---|---|
| Total Energy Expenditures | Total Energy Expenditures Per Capita | Total Energy Expenditures | Total Energy Expenditures Per Capita | |
| 2022 | $12,714,300,000 | $6460.30 | $1,719,438,100,000 | $5,159.30 |
| 2021 | $9,649,800,000 | $4,912.70 | $1,316,977,800,000 | $3,966.20 |
| 2020 | $7,637,000,000 | $3,891.20 | $1,007,785,400,000 | $3,040.00 |
| 2019 | $8,895,300,000 | $4,602.80 | $1,223,861,900,000 | $3,727.50 |
| 2018 | $9,142,600,000 | $4,748.10 | $1,271,632,500,000 | $3,890.70 |
| 2017 | $8,244,600,000 | $4,303.10 | $1,136,189,300,000 | $3,496.10 |
| 2016 | $7,548,000,000 | $3,960.90 | $1,038,272,500,000 | $3,215.00 |
| 2015 | $8,192,200,000 | $4,325.90 | $1,127,132,400,000 | $3,512.40 |
| 2014 | $10,376,800,000 | $5,516.20 | $1,399,486,000,000 | $4,393.10 |
| 2013 | $10,361,000,000 | $5,544.90 | $1,378,884,700,000 | $4,360.70 |
| 2012 | $10,149,800,000 | $5,469.50 | $1,356,215,300,000 | $4,319.20 |
| 2011 | $9,997,700,000 | $5,426.80 | $1,392,945,000,000 | $4,469.40 |
| 2010 | $8,724,700,000 | $4,767.50 | $1,213,335,600,000 | $3,922.20 |
Total Energy Expenditures Per Capita
Nebraska and the United States
1990 – 2009
| Year | Nebraska | United States | ||
|---|---|---|---|---|
| Total Energy Expenditures | Total Energy Expenditures Per Capita | Total Energy Expenditures | Total Energy Expenditures Per Capita | |
| 2009 | $7,154,600,000 | $3,947.00 | $1,066,274,600,000 | $3,475.80 |
| 2008 | $9,103,000,000 | $5,067.40 | $1,408,750,100,000 | $4,632.60 |
| 2007 | $7,956,600,000 | $4,461.40 | $1,233,864,000,000 | $4,096.10 |
| 2006 | $7,216,700,000 | $4,071.00 | $1,158,818,800,000 | $3,883.70 |
| 2005 | $6,448,000,000 | $3,660.50 | $1,045,729,000,000 | $3,538.60 |
| 2004 | $5,404,900,000 | $3,089.60 | $871,209,500,000 | $2,975.40 |
| 2003 | $4,745,300,000 | $2,729.30 | $755,068,200,000 | $2,602.70 |
| 2002 | $4,197,600,000 | $2,428.80 | $663,961,700,000 | $2,308.40 |
| 2001 | $4,454,400,000 | $2,590.00 | $696,239,800,000 | $2,443.20 |
| 2000 | $4,382,100,000 | $2,556.90 | $687,707,800,000 | $2,437.30 |
| 1999 | $3,601,300,000 | $2,112.50 | $558,623,700,000 | $2,001.90 |
| 1998 | $3,496,700,000 | $2,061.90 | $526,280,400,000 | $1,907.80 |
| 1997 | $3,776,400,000 | $2,239.30 | $567,960,300,000 | $2,083.10 |
| 1996 | $3,735,800,000 | $2,232.00 | $560,291,900,000 | $2,079.80 |
| 1995 | $3,338,500,000 | $2,014.80 | $514,621,600,000 | $1,932.60 |
| 1994 | $3,249,700,000 | $1,982.70 | $504,853,800,000 | $1,918.70 |
| 1993 | $3,161,700,000 | $1,944.90 | $492,266,700,000 | $1,893.90 |
| 1992 | $3,063,500,000 | $1,900.80 | $476,840,100,000 | $1,858.90 |
| 1991 | $3,131,900,000 | $1,962.40 | $472,434,300,000 | $1,867.50 |
| 1990 | $3,163,900,000 | $2,000.40 | $474,647,300,000 | $1,901.50 |
Total Energy Expenditures Per Capita
Nebraska and the United States
1970 – 1989
| Year | Nebraska | United States | ||
|---|---|---|---|---|
| Total Energy Expenditures | Total Energy Expenditures Per Capita | Total Energy Expenditures | Total Energy Expenditures Per Capita | |
| 1989 | $2,948,800,000 | $1,872.40 | $439,046,100,000 | $1,778.80 |
| 1988 | $2,755,500,000 | $1,753.50 | $411,564,700,000 | $1,683.30 |
| 1987 | $2,629,700,000 | $1,678.60 | $397,622,900,000 | $1,641.10 |
| 1986 | $2,528,000,000 | $1,605.80 | $384,087,500,000 | $1,599.50 |
| 1985 | $2,948,000,000 | $1,860.30 | $438,339,500,000 | $1,842.40 |
| 1984 | $2,970,500,000 | $1,869.80 | $435,309,500,000 | $1,845.90 |
| 1983 | $2,991,100,000 | $1,888.00 | $417,617,400,000 | $1,786.30 |
| 1982 | $2,811,700,000 | $1,777.50 | $426,478,600,000 | $1,840.90 |
| 1981 | $2,726,700,000 | $1,727.40 | $427,898,000,000 | $1,864.80 |
| 1980 | $2,456,200,000 | $1,562.20 | $374,346,800,000 | $1,647.50 |
| 1979 | $2,019,500,000 | $1,288.50 | $297,571,700,000 | $1,322.20 |
| 1978 | $1,669,500,000 | $1,067.50 | $239,277,100,000 | $1,075.00 |
| 1977 | $1,551,800,000 | $996.70 | $220,495,800,000 | $1,001.20 |
| 1976 | $1,410,300,000 | $909.40 | $193,912,800,000 | $889.40 |
| 1975 | $1,204,900,000 | $780.80 | $171,851,100,000 | $795.70 |
| 1974 | $1,054,800,000 | $685.30 | $153,366,500,000 | $717.20 |
| 1973 | $835,500,000 | $546.20 | $111,891,500,000 | $528.00 |
| 1972 | $754,600,000 | $496.70 | $98,070,200,000 | $467.20 |
| 1971 | $707,200,000 | $470.00 | $90,037,800,000 | $433.60 |
| 1970 | $667,800,000 | $448.80 | $82,874,800,000 | $404.20 |
Sources: State Energy Price and Expenditure Report. Energy Information Administration, Washington, DC. Nebraska Department of Water, Energy, and Environment, Lincoln, NE.
