Expenditures in the Electric Power Sector
The electric power sector consists of facilities which generate electricity primarily for use by the public. Energy is used for the generation, distribution, and transmission of electric power.
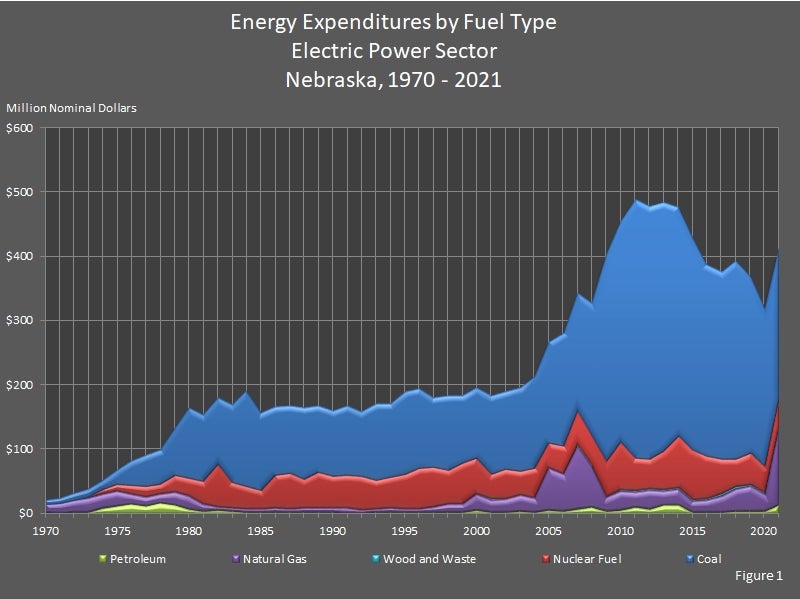
Total electric power sector expenditures on energy decreased 4.8 percent to $423.0 million from 2021 to 2022. Natural gas expenditures decreased 29.9 percent, petroleum expenditures decreased 15.3 percent, and nuclear fuel expenditures decreased 14.1 percent. Coal expenditures increased 13.7 percent, and wood and waste expenditures increased 4.8 percent.
In 2022, the electric power sector spent $266.2 million for coal, $37.7 million for nuclear fuel, $105.8 million for natural gas, $11.1 million for petroleum, and $2.2 million for wood and waste. There were no direct fuel costs for hydroelectric, geothermal, wind, photovoltaic, or solar thermal energy.
Coal expenditures were over half (62.9 percent) of the money spent in the electric power sector on energy in 2022. Expenditures on natural gas and nuclear fuel were 25.0 percent and 8.9 percent, respectively, of the total. Petroleum expenditures were 2.6 percent while wood and waste expenditures were 0.52 percent of the total.
The expenditures are in nominal dollars to provide a better comparison.

Nebraska Energy Expenditures by Fuel Type, Electric Power Sector 2010 – 2022
(Million Nominal Dollars)
Year | Coal | Natural Gas | Nuclear Fuel | Petroleum | Renewable | Annual Total |
---|---|---|---|---|---|---|
Wood and Waste | ||||||
2022 | $266.2 | $105.8 | $37.3 | $11.1 | $2.2 | $423.0 |
2021 | $234.2 | $151.0 | $43.9 | $13.1 | $2.1 | $444.3 |
2020 | $245.8 | $27.3 | $41.9 | $2.7 | $1.6 | $319.2 |
2019 | $275.0 | $38.0 | $49.8 | $3.6 | $1.8 | $368.3 |
2018 | $308.3 | $34.7 | $43.9 | $3.4 | $1.9 | $392.6 |
2017 | $291.9 | $25.8 | $54.6 | $1.2 | $2.0 | $375.7 |
2016 | $296.9 | $19.2 | $66.7 | $1.0 | $2.0 | $385.8 |
2015 | $329.7 | $16.9 | $77.2 | $1.7 | $1.9 | $427.4 |
2014 | $355.5 | $24.5 | $81.0 | $12.5 | $1.7 | $475.2 |
2013 | $386.7 | $22.8 | $60.0 | $12.1 | $1.4 | $483.0 |
2012 | $392.2 | $30.2 | $46.5 | $5.7 | $1.3 | $475.9 |
2011 | $402.7 | $24.2 | $50.2 | $9.1 | $1.6 | $487.9 |
2010 | $342.5 | $28.2 | $74.8 | $5.7 | $1.8 | $452.9 |
Nebraska Energy Expenditures by Fuel Type, Electric Power Sector 1990 – 2009
(Million Nominal Dollars)
Year | Coal | Natural Gas | Nuclear Fuel | Petroleum | Renewable | Annual Total |
---|---|---|---|---|---|---|
Wood and Waste | ||||||
2009 | $321.4 | $20.9 | $55.6 | $3.5 | $1.4 | $402.9 |
2008 | $204.9 | $64.6 | $47.1 | $8.9 | $1.6 | $327.1 |
2007 | $183.3 | $97.8 | $53.2 | $6.1 | $1.5 | $342.6 |
2006 | $175.8 | $56.9 | $44.4 | $3.6 | $0.3 | $281.0 |
2005 | $156.6 | $65.8 | $39.2 | $4.1 | $0.2 | $265.9 |
2004 | $142.4 | $21.7 | $46.8 | $1.9 | $0.2 | $213.0 |
2003 | $131.3 | $25.9 | $36.1 | $2.7 | $0.2 | $196.3 |
2002 | $121.9 | $20.6 | $46.3 | $1.4 | $0.2 | $190.3 |
2001 | $122.4 | $18.7 | $40.3 | $2.4 | $0.1 | $184.0 |
2000 | $111.1 | $25.8 | $55.1 | $4.2 | $0.1 | $196.3 |
1999 | $105.8 | $13.0 | $63.1 | $1.7 | $0.1 | $184.5 |
1998 | $115.8 | $12.4 | $53.1 | $1.8 | $0.0 | $184.0 |
1997 | $108.6 | $7.8 | $62.7 | $1.9 | $0.1 | $181.0 |
1996 | $124.7 | $4.8 | $63.4 | $1.4 | $0.1 | $194.4 |
1995 | $129.2 | $5.1 | $53.5 | $1.5 | $0.1 | $189.5 |
1994 | $116.6 | $6.2 | $48.1 | $1.1 | $0.1 | $172.1 |
1993 | $120.2 | $5.1 | $45.7 | $1.0 | $0.1 | $172.1 |
1992 | $100.6 | $4.4 | $52.6 | $0.7 | $0.1 | $158.3 |
1991 | $108.5 | $6.9 | $52.2 | $0.8 | $0.0 | $168.3 |
1990 | $103.4 | $7.3 | $48.8 | $1.3 | $0.0 | $160.7 |
Nebraska Energy Expenditures by Fuel Type, Electric Power Sector 1970 – 1989
(Million Nominal Dollars)
Year | Coal | Natural Gas | Nuclear Fuel | Petroleum | Renewable | Annual Total |
---|---|---|---|---|---|---|
Wood and Waste | ||||||
1989 | $103.9 | $5.9 | $55.6 | $2.1 | $0.0 | $167.5 |
1988 | $112.3 | $5.2 | $45.9 | $2.4 | $0.0 | $165.9 |
1987 | $104.5 | $4.4 | $57.1 | $1.6 | $0.0 | $167.6 |
1986 | $107.7 | $5.3 | $51.7 | $1.9 | $0.0 | $166.7 |
1985 | $122.9 | $4.4 | $28.7 | $2.1 | $0.0 | $158.2 |
1984 | $149.9 | $4.8 | $35.5 | $1.5 | $0.0 | $191.7 |
1983 | $121.0 | $4.9 | $41.1 | $2.7 | $0.0 | $169.7 |
1982 | $105.3 | $4.6 | $66.2 | $5.1 | $0.0 | $181.3 |
1981 | $104.4 | $10.3 | $36.3 | $3.7 | $0.0 | $154.8 |
1980 | $109.8 | $20.5 | $27.7 | $6.7 | $0.0 | $164.7 |
1979 | $74.1 | $19.3 | $27.5 | $12.9 | $0.0 | $133.8 |
1978 | $54.1 | $13.8 | $16.6 | $15.2 | $0.0 | $99.7 |
1977 | $51.0 | $14.6 | $16.0 | $11.0 | $0.0 | $92.6 |
1976 | $39.1 | $15.5 | $12.9 | $14.7 | $0.0 | $82.2 |
1975 | $23.4 | $23.3 | $11.0 | $10.5 | $0.0 | $68.1 |
1974 | $15.7 | $23.0 | $7.0 | $7.3 | $0.0 | $53.2 |
1973 | $14.2 | $22.1 | $1.1 | $2.1 | $0.0 | $39.5 |
1972 | $12.2 | $18.2 | $0.0 | $2.4 | $0.0 | $32.8 |
1971 | $8.8 | $15.2 | $0.0 | $0.9 | $0.0 | $24.9 |
1970 | $8.5 | $12.8 | $0.0 | $1.0 | $0.0 | $22.3 |
Sources: State Energy Price and Expenditure Report. Energy Information Administration, Washington, DC. Nebraska Department of Environment and Energy, Lincoln, NE.
Notes: There are no direct fuel costs for hydroelectric, geothermal, wind, photovoltaic, or solar thermal energy. Totals may not equal the sum of the components due to independent rounding.