Expenditures in the Commercial Sector
The commercial sector consists of nonmanufacturing business establishments. Included are hotels, motels, restaurants, wholesale businesses, retail stores, laundries, and other service enterprises; health, social, and educational institutions; and federal, state, and local governments. Streetlights, pumps, bridges, and public services are also included. Dollars spent on fuel used in motor vehicles for commercial purposes is included in the transportation sector. Examples of common expenditures of energy in the commercial sector include space heating, water heating, refrigeration, air conditioning, and cooking.
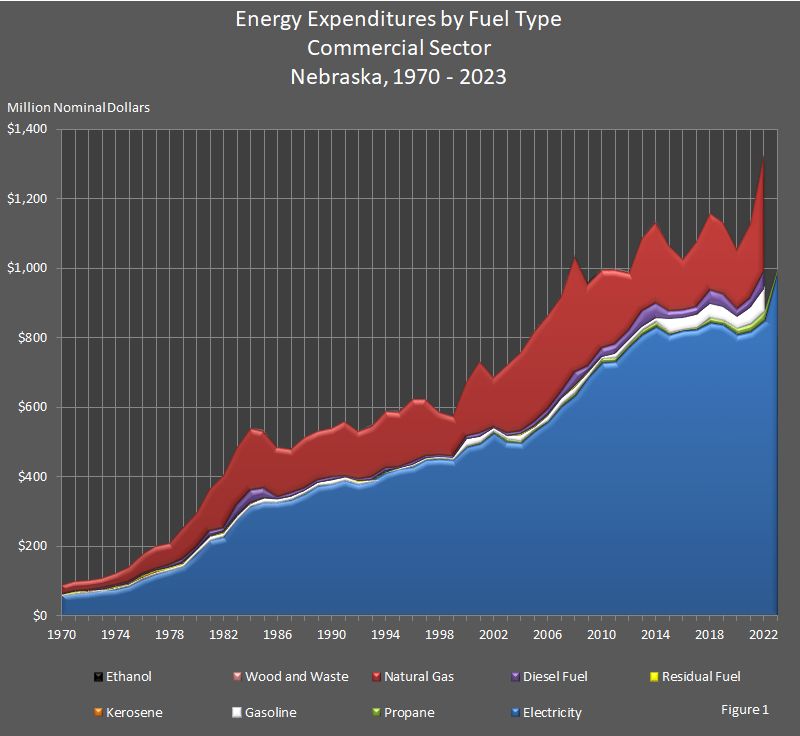
Total commercial sector expenditures on energy increased 8.3 percent to $1,439.5 million from 2022 to 2023. In 2023, the commercial sector spent $986.1 million for electricity, $347.4 million for natural gas, $54.2 million for motor gasoline, $37.1 million for diesel fuel, $12.7 million for propane, $1.5 million for wood and waste, and $0.4 million for residual fuel. If any fuel had consumption low enough to round to zero, the expenditure is shown as $0. Also, the Energy Information Administration rounded all expenditures to one decimal so a fuel expenditure less than $0.05 million dollars would be shown as $0.0 million dollars in the table below. Expenditures on ethanol were not tracked. There are no direct fuel costs for hydroelectric, geothermal, wind, photovoltaic, or solar thermal energy.
Electricity expenditures were more than half (68.5 percent) of the total money spent in the commercial sector on energy in 2023 with expenditures on natural gas comprising a quarter (24.1 percent) of the total. Motor gasoline expenditures comprised 3.8 percent, and diesel fuel comprised 2.6 percent. Expenditures on each of the other fuels were less than one percent.
The expenditures are in nominal dollars to provide a better comparison.
| Attachment | Size |
|---|---|
| 2010 - 2023 | 44.87 KB |
| 1990 - 2009 | 45.38 KB |
| 1970 - 1989 | 45.51 KB |
Sources: State Energy Price and Expenditure Report. Energy Information Administration, Washington, DC. Nebraska Department of Water, Energy, and Environment, Lincoln, NE.