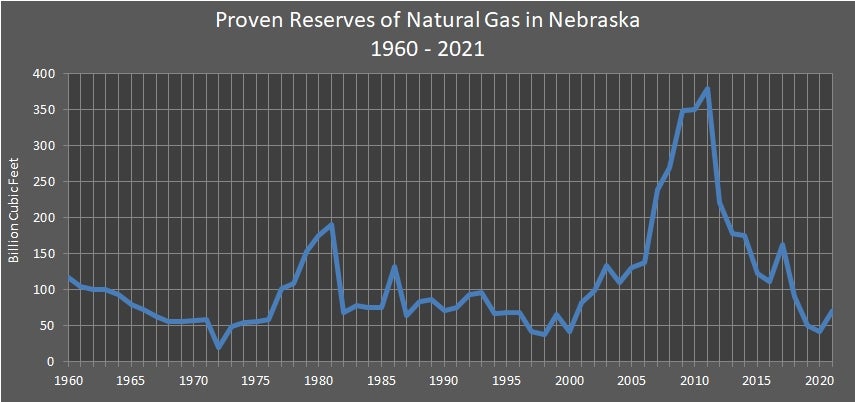
Nebraska's Dry Natural Gas Proven Reserves
The estimated quantity of natural gas which geological and engineering data demonstrate with a given probability to be recoverable in the future assuming current costs of operation and market prices are proven reserves. Nebraska's dry natural gas reserves are given for the years 1960 to 2021 in the table below.
Proven reserves for Nebraska peaked in 1960 at 117.8 billion cubic feet. Beginning in 1977, Nebraska's reserves have been included with a group of miscellaneous states, including Arizona, Florida, Idaho, Illinois, Indiana, Maryland, Missouri, Nevada, Oregon, South Dakota, and Tennessee. Individual state volumes are withheld for these states to avoid disclosure of operator–level reserves data or because of other statistical prevision or data quality reasons. Proven reserves for this group of miscellaneous states peaked in 2011 at 379 billion cubic feet. Prior to 2011, the previous four years had also surpassed the peak reached in 1981 at 191 billion cubic feet.

Nebraska Dry Natural Gas Proven Reserves 1960 – 2021
(Billion Cubic Feet at 14.73 psia and 60 Degrees Fahrenheit as of December 31)
| Year | Proven Reserves | Year | Proven Reserves | Year | Proven Reserves | Year | Proven Reserves | Year | Proven Reserves | Year | Proven Reserves | Year | Proven Reserves | ||||||
|---|---|---|---|---|---|---|---|---|---|---|---|---|---|---|---|---|---|---|---|
| 1960 | 117.8 | 1970 | 58.2 | 1980 | 176.0 | 1990 | 72.0 | 2000 | 42.0 | 2010 | 350.0 | 2020 | 42.0 | ||||||
| 1961 | 104.3 | 1971 | 59.4 | 1981 | 191.0 | 1991 | 76.0 | 2001 | 82.0 | 2011 | 379.0 | 2021 | 72.0 | ||||||
| 1962 | 100.7 | 1972 | 50.3 | 1982 | 69.0 | 1992 | 93.0 | 2002 | 99.0 | 2012 | 222.0 | 2022 | NA | ||||||
| 1963 | 100.0 | 1973 | 48.8 | 1983 | 78.0 | 1993 | 96.0 | 2003 | 134.0 | 2013 | 179.0 | 2023 | NA | ||||||
| 1964 | 93.4 | 1974 | 54.6 | 1984 | 75.0 | 1994 | 67.0 | 2004 | 110.0 | 2014 | 176.0 | 2024 | NA | ||||||
| 1965 | 79.6 | 1975 | 55.8 | 1985 | 76.0 | 1995 | 69.0 | 2005 | 131.0 | 2015 | 123.0 | 2025 | NA | ||||||
| 1966 | 72.8 | 1976 | 59.2 | 1986 | 133.0 | 1996 | 69.0 | 2006 | 138.0 | 2016 | 112.0 | 2026 | NA | ||||||
| 1967 | 63.8 | 1977 | 102.0 | 1987 | 65.0 | 1997 | 43.0 | 2007 | 239.0 | 2017 | 163.0 | 2027 | NA | ||||||
| 1968 | 56.8 | 1978 | 109.0 | 1988 | 84.0 | 1998 | 38.0 | 2008 | 270.0 | 2018 | 91.0 | 2028 | NA | ||||||
| 1969 | 56.6 | 1979 | 153.0 | 1989 | 87.0 | 1999 | 66.0 | 2009 | 349.0 | 2019 | 50.0 | 2029 | NA |
Sources: U.S. Crude Oil and Natural Gas Proved Reserves. Energy Information Administration, Washington, DC. Nebraska Department of Environment and Energy, Lincoln, NE.