Compressed Natural Gas Consumption as Vehicle Fuel in Nebraska
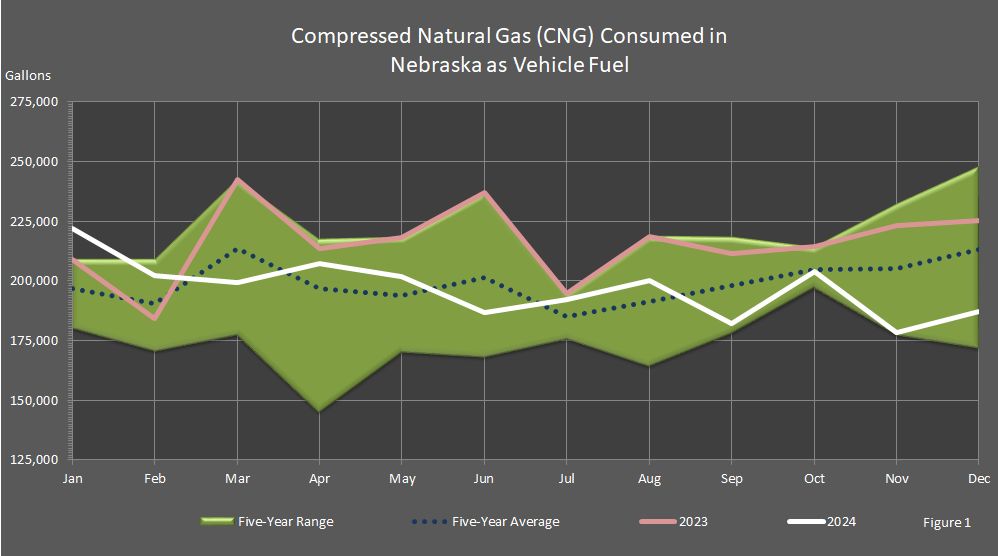
Compressed natural gas (CNG) consumption for vehicle use was volatile from January to August, just like in 2023, but leveled out the rest of 2024. Consumption was at the upper boundary or above the five–year range the majority of the time in 2024. Consumption was above the five–year average for eleven months of the year. 2024 consumption mimicked the year 2023 consumption with the exception of February. This is seen in Figure 1.
As shown in the data table below, the amount of compressed natural gas (CNG) consumed as vehicle fuel had been relatively stable from month to month during 2006 to mid-2011 with a bit of volatility thrown in the summer and fall months. During August and September of 2011, CNG experienced a spike in consumption and then consumption skyrocketed in November and December. This increase in consumption was due to the drop in natural gas prices. Significantly lower natural gas prices continued from 2012 to 2021. In February 2021, prices skyrocketed due to the polar vortex in Texas but returned to the five–year range. In the last half of 2021, natural gas prices soared with the onset of winter. At the end of the year, prices had fallen back into the five–year range. In 2022, natural gas prices skyrocketed from the second week in January to mid–December. Prices were very unstable. Consumption in 2022 was high regardless of natural gas prices. This could have been due to the increase in alternative fuel vehicles. See the "Henry Hub Natural Gas Spot Prices" report and "The Number of Registered Vehicles in Nebraska by the Fuel Consumed" report for additional information.

| Attachment | Size |
|---|---|
| 2006 - 2024 | 139.79 KB |
Sources: "Monthly Motor–Fuel Consumption." Nebraska Department of Revenue, Motor Fuels Division, Lincoln, NE. Nebraska Department of Water, Energy, and Environment, Lincoln, NE.
Notes: The numbers are net volume numbers. NA indicates data is not available. Organizations, groups, companies, fuels, or individuals in the agency’s pages are for information only and are not an endorsement by the State of Nebraska or the Nebraska Department of Water, Energy, and Environment and its management or staff.
