Natural Gas Production in Nebraska
Natural gas production for 2022 was 320.3 million (0.32 billion) cubic feet, which was a decrease of 0.2 percent from the 2021 production of 326.8 million (0.33 billion) cubic feet. The record high was in the year 1960 when 28.2 billion cubic feet of natural gas was produced. Natural gas production for 2008 was 3.1 billion cubic feet, nearly double the production (98 percent) from 2007 when production was 1.6 billion cubic feet. The increase in 2008 was due to high natural gas prices. More information can be found in the report Natural Gas Production by County.
In 2021, Nebraskans consumed 180.1 billion cubic feet of natural gas. Consumption is not available for more recent years. Nebraska's natural gas production in 2021 was 326.8 million (0.33 billion) cubic feet which represented only 0.18 percent of the natural gas consumed in the state.
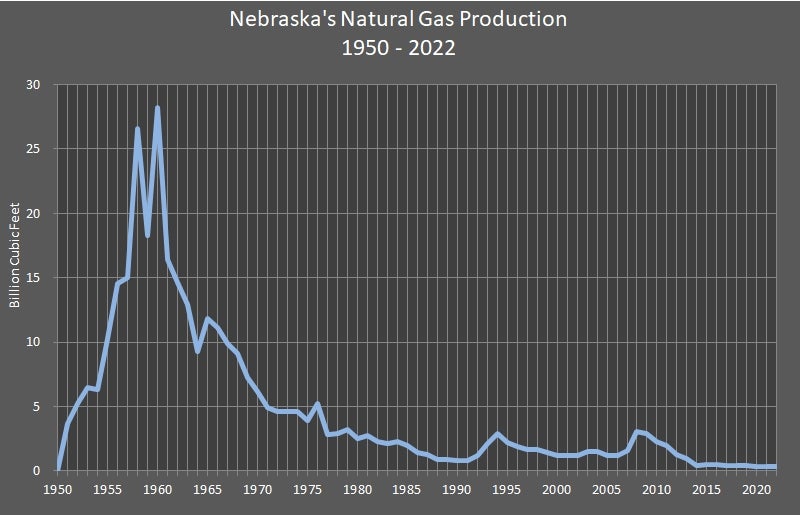
Nebraska's Natural Gas Production 1950 – 2022
(Thousand Cubic Feet)
| Year | Cubic Feet | Year | Cubic Feet | Year | Cubic Feet | Year | Cubic Feet | Year | Cubic Feet | Year | Cubic Feet | Year | Cubic Feet | Year | Cubic Feet |
|---|---|---|---|---|---|---|---|---|---|---|---|---|---|---|---|
| 1950 | 1,881 | 1960 | 28,189,817 | 1970 | 6,184,845 | 1980 | 2,500,276 | 1990 | 793,142 | 2000 | 1,218,420 | 2010 | 2,253,556 | 2020 | 348,112 |
| 1951 | 3,678,600 | 1961 | 16,385,851 | 1971 | 4,955,127 | 1981 | 2,712,781 | 1991 | 783,503 | 2001 | 1,209,030 | 2011 | 1,979,849 | 2021 | 326,788 |
| 1952 | 5,232,091 | 1962 | 14,644,383 | 1972 | 4,646,995 | 1982 | 2,279,799 | 1992 | 1,176,501 | 2002 | 1,192,599 | 2012 | 1,288,929 | 2022 | 320,288 |
| 1953 | 6,467,053 | 1963 | 12,909,175 | 1973 | 4,579,029 | 1983 | 2,091,328 | 1993 | 2,114,246 | 2003 | 1,470,788 | 2013 | 949,694 | 2023 | NA |
| 1954 | 6,328,683 | 1964 | 9,303,924 | 1974 | 4,583,565 | 1984 | 2,300,268 | 1994 | 2,898,337 | 2004 | 1,498,780 | 2014 | 401,576 | 2024 | NA |
| 1955 | 10,264,632 | 1965 | 11,790,398 | 1975 | 3,884,635 | 1985 | 1,944,569 | 1995 | 2,239,897 | 2005 | 1,200,925 | 2015 | 476,175 | 2025 | NA |
| 1956 | 14,543,124 | 1966 | 11,097,418 | 1976 | 5,200,371 | 1986 | 1,403,485 | 1996 | 1,875,997 | 2006 | 1,217,450 | 2016 | 526,420 | 2026 | NA |
| 1957 | 15,041,526 | 1967 | 9,884,224 | 1977 | 2,796,144 | 1987 | 1,260,540 | 1997 | 1,669,685 | 2007 | 1,559,564 | 2017 | 454,721 | 2027 | NA |
| 1958 | 26,609,513 | 1968 | 9,146,108 | 1978 | 2,882,045 | 1988 | 910,468 | 1998 | 1,694,625 | 2008 | 3,083,488 | 2018 | 431,470 | 2028 | NA |
| 1959 | 18,243,908 | 1969 | 7,240,347 | 1979 | 3,224,877 | 1989 | 878,517 | 1999 | 1,396,844 | 2009 | 2,916,387 | 2019 | 381,674 | 2029 | NA |
Sources: "Nebraska Oil Activity Summary." Nebraska Oil and Gas Conservation Commission, Sidney, NE. Nebraska Department of Water, Energy, and Environment, Lincoln, NE.