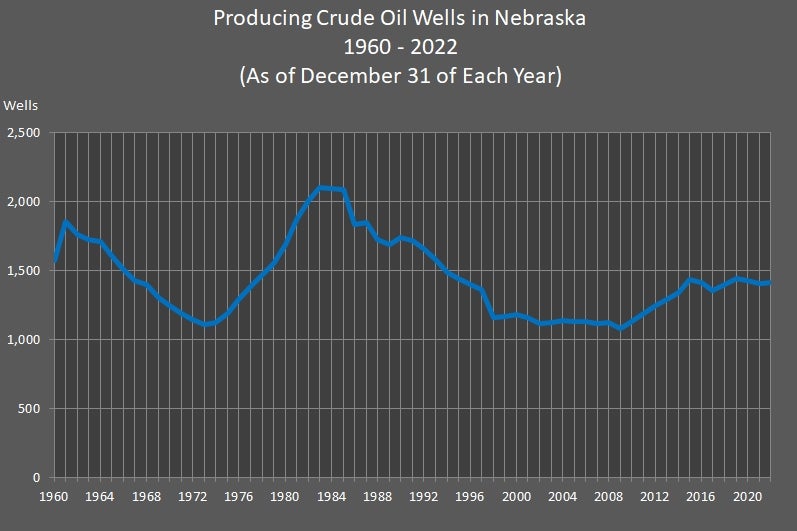
Producing Crude Oil Wells

| Year | Producing Wells | Year | Producing Wells | Year | Producing Wells | Year | Producing Wells | Year | Producing Wells | Year | Producing Wells | Year | Producing Wells | ||||||
|---|---|---|---|---|---|---|---|---|---|---|---|---|---|---|---|---|---|---|---|
| 1960 | 1,571 | 1970 | 1,244 | 1980 | 1,693 | 1990 | 1,742 | 2000 | 1,179 | 2010 | 1,134 | 2020 | 1,429 | ||||||
| 1961 | 1,860 | 1971 | 1,191 | 1981 | 1,870 | 1991 | 1,716 | 2001 | 1,161 | 2011 | 1,186 | 2021 | 1,405 | ||||||
| 1962 | 1,764 | 1972 | 1,143 | 1982 | 2,006 | 1992 | 1,660 | 2002 | 1,119 | 2012 | 1,247 | 2022 | 1,417 | ||||||
| 1963 | 1,726 | 1973 | 1,107 | 1983 | 2,100 | 1993 | 1,582 | 2003 | 1,124 | 2013 | 1,288 | 2023 | NA | ||||||
| 1964 | 1,711 | 1974 | 1,127 | 1984 | 2,095 | 1994 | 1,489 | 2004 | 1,141 | 2014 | 1,340 | 2024 | NA | ||||||
| 1965 | 1,611 | 1975 | 1,190 | 1985 | 2,091 | 1995 | 1,446 | 2005 | 1,133 | 2015 | 1,436 | 2025 | NA | ||||||
| 1966 | 1,511 | 1976 | 1,291 | 1986 | 1,838 | 1996 | 1,402 | 2006 | 1,134 | 2016 | 1,415 | 2026 | NA | ||||||
| 1967 | 1,430 | 1977 | 1,382 | 1987 | 1,852 | 1997 | 1,361 | 2007 | 1,116 | 2017 | 1,353 | 2027 | NA | ||||||
| 1968 | 1,403 | 1978 | 1,469 | 1988 | 1,723 | 1998 | 1,160 | 2008 | 1,123 | 2018 | 1,397 | 2028 | NA | ||||||
| 1969 | 1,305 | 1979 | 1,551 | 1989 | 1,687 | 1999 | 1,170 | 2009 | 1,077 | 2019 | 1,441 | 2029 | NA |
Sources: "Nebraska Oil Activity Summary." Nebraska Oil and Gas Conservation Commission, Sidney, NE. Nebraska Department of Water, Energy, and Environment, Lincoln, NE.
