Petroleum Consumption by Product
Petroleum use in Nebraska for 2022 was 46,112 thousand barrels (46.1 million barrels), an increase of 3.5 percent from 2021. A new record was set in 2019 at 47,565 thousand barrels (47.6 million barrels).
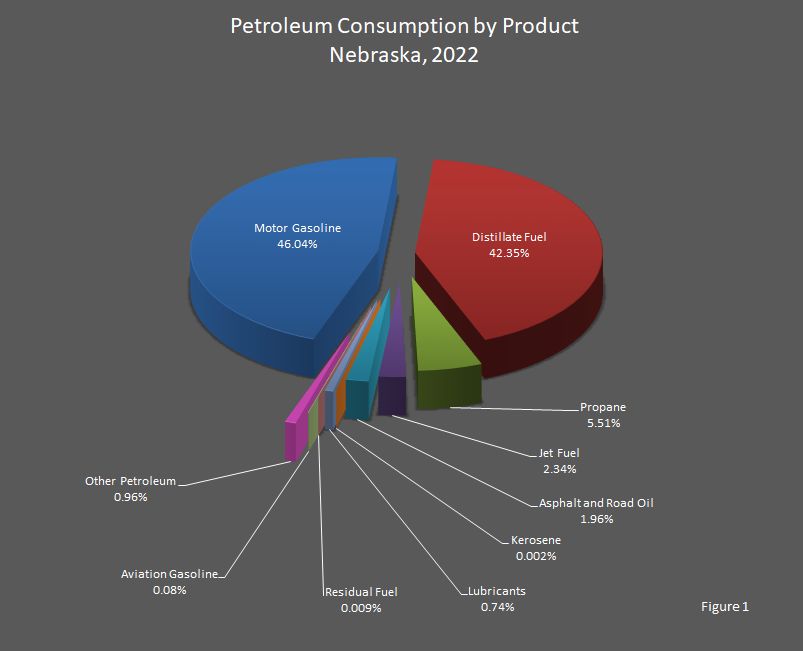
Figure 1 shows that motor gasoline and distillate fuel (diesel fuel and heating oil) made up nearly equal slices of the pie resulting in 88.4 percent of the total petroleum products consumed in 2022. Propane made up 6 percent, jet fuel made up 2 percent, and asphalt and road oil made up 2 percent. Each of the other fuels' consumption was less than 1 percent of the pie.
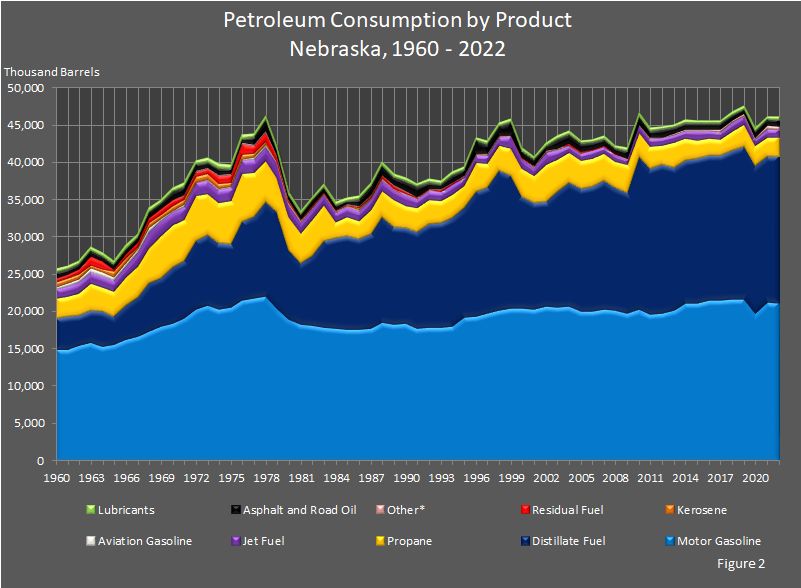
Figure 2 shows, over the last sixty–two years, people have consumed more motor gasoline than any of the other petroleum products, with distillate fuel running a close second.


| Year | Asphalt and Road Oil | Aviation Gasoline | Distillate Fuel Oil | Jet Fuel | Kerosene | Lubricants | Motor Gasoline | Other Petro– leum 1 | Propane | Residual Fuel | Total |
|---|---|---|---|---|---|---|---|---|---|---|---|
| 2022 | 906 | 36 | 19,530 | 1,080 | 1 | 341 | 21,228 | 443 | 2,543 | 4 | 46,112 |
| 2021 | 931 | 35 | 19,523 | 1,068 | 1 | 318 | 21,293 | 426 | 2,576 | 4 | 46,175 |
| 2020 | 942 | 36 | 19,729 | 867 | 1 | 300 | 19,875 | 154 | 2,693 | 3 | 44,600 |
| Year | Asphalt and Road Oil | Aviation Gasoline | Distillate Fuel Oil | Jet Fuel | Kerosene | Lubricants | Motor Gasoline | Other Petro– leum 1 | Propane | Residual Fuel | Total |
|---|---|---|---|---|---|---|---|---|---|---|---|
| 2019 | 772 | 37 | 20,445 | 1,161 | 2 | 313 | 21,717 | 163 | 2,951 | 3 | 47,565 |
| 2018 | 860 | 38 | 19,940 | 1,193 | 1 | 325 | 21,677 | 179 | 2,567 | 6 | 46,785 |
| 2017 | 974 | 36 | 19,345 | 1,120 | 1 | 327 | 21,526 | 178 | 2,132 | 1 | 45,641 |
| 2016 | 875 | 38 | 19,316 | 1,033 | 2 | 330 | 21,615 | 110 | 2,312 | 0 | 45,630 |
| 2015 | 953 | 38 | 19,374 | 1,248 | 1 | 346 | 21,122 | 109 | 2,477 | 0 | 45,669 |
| 2014 | 929 | 38 | 19,161 | 1,053 | 2 | 325 | 21,133 | 109 | 2,933 | 1 | 45,685 |
| 2013 | 922 | 35 | 19,070 | 1,104 | 1 | 314 | 20,282 | 104 | 3,244 | 0 | 45,076 |
| 2012 | 1,139 | 44 | 19,832 | 1,025 | 1 | 307 | 19,813 | 37 | 2,589 | 1 | 44,788 |
| 2011 | 1,017 | 46 | 19,486 | 1,019 | 2 | 340 | 19,733 | 37 | 2,947 | 1 | 44,628 |
| 2010 | 1,141 | 49 | 20,350 | 1,084 | 5 | 365 | 20,361 | 39 | 3,230 | 1 | 46,624 |
| 2009 | 1,096 | 63 | 16,139 | 697 | 7 | 288 | 19,871 | 33 | 3,727 | 8 | 41,928 |
| 2008 | 810 | 66 | 16,374 | 888 | 4 | 320 | 20,217 | 38 | 3,503 | 81 | 42,302 |
| 2007 | 904 | 79 | 17,242 | 968 | 9 | 345 | 20,336 | 40 | 3,537 | 70 | 43,528 |
| 2006 | 1,053 | 80 | 16,534 | 1,060 | 8 | 334 | 20,163 | 44 | 3,762 | 77 | 43,115 |
| 2005 | 1,216 | 82 | 16,299 | 934 | 18 | 342 | 20,148 | 36 | 3,768 | 145 | 42,990 |
| 2004 | 1,301 | 56 | 16,435 | 918 | 22 | 344 | 20,840 | 36 | 4,039 | 231 | 44,222 |
| 2003 | 1,336 | 81 | 15,406 | 1,205 | 16 | 340 | 20,673 | 37 | 4,328 | 142 | 43,564 |
| 2002 | 803 | 93 | 13,936 | 1,527 | 7 | 368 | 20,846 | 39 | 4,943 | 124 | 42,685 |
| 2001 | 856 | 86 | 14,207 | 1,113 | 21 | 372 | 20,392 | 41 | 3,615 | 127 | 40,831 |
| 2000 | 937 | 64 | 14,937 | 1,231 | 15 | 406 | 20,457 | 19 | 3,830 | 142 | 42,038 |
| Year | Asphalt and Road Oil | Aviation Gasoline | Distillate Fuel Oil | Jet Fuel | Kerosene | Lubricants | Motor Gasoline | Other Petro– leum 1 | Propane | Residual Fuel | Total |
|---|---|---|---|---|---|---|---|---|---|---|---|
| 1999 | 1,867 | 71 | 17,754 | 1,564 | 11 | 412 | 20,487 | 22 | 3,665 | 77 | 45,930 |
| 1998 | 1,400 | 63 | 18,646 | 1,081 | 23 | 408 | 20,305 | 24 | 3,300 | 116 | 45,366 |
| 1997 | 1,450 | 90 | 16,848 | 1,075 | 23 | 390 | 19,825 | 25 | 3,130 | 110 | 42,966 |
| 1996 | 1,771 | 75 | 16,644 | 1,007 | 19 | 369 | 19,474 | 28 | 3,831 | 167 | 43,386 |
| 1995 | 929 | 77 | 14,599 | 1,001 | 17 | 380 | 19,302 | 31 | 3,020 | 121 | 39,475 |
| 1994 | 1,031 | 76 | 14,595 | 1,259 | 21 | 387 | 18,043 | 31 | 3,080 | 212 | 38,734 |
| 1993 | 797 | 72 | 13,847 | 1,157 | 24 | 370 | 18,029 | 30 | 2,984 | 275 | 37,586 |
| 1992 | 898 | 81 | 13,848 | 1,198 | 20 | 363 | 17,951 | 28 | 3,225 | 185 | 37,797 |
| 1991 | 1,418 | 84 | 12,949 | 1,192 | 17 | 356 | 17,801 | 26 | 3,167 | 199 | 37,211 |
| 1990 | 1,388 | 83 | 12,848 | 1,501 | 41 | 398 | 18,451 | 316 | 2,912 | 257 | 38,196 |
| 1989 | 1,130 | 93 | 12,894 | 1,488 | 22 | 387 | 18,427 | 286 | 3,622 | 373 | 38,722 |
| 1988 | 1,262 | 96 | 14,121 | 1,505 | 76 | 377 | 18,609 | 290 | 3,500 | 412 | 40,247 |
| 1987 | 1,241 | 90 | 12,606 | 1,373 | 104 | 391 | 17,885 | 282 | 3,218 | 265 | 37,455 |
| 1986 | 954 | 117 | 12,024 | 1,353 | 168 | 346 | 17,757 | 277 | 2,449 | 252 | 35,698 |
| 1985 | 473 | 96 | 12,411 | 1,357 | 74 | 354 | 17,737 | 75 | 2,590 | 62 | 35,229 |
| 1984 | 631 | 107 | 12,003 | 1,385 | 88 | 380 | 17,871 | 74 | 2,118 | 70 | 34,726 |
| 1983 | 668 | 119 | 11,547 | 1,482 | 76 | 356 | 17,905 | 74 | 4,818 | 105 | 37,150 |
| 1982 | 736 | 123 | 9,253 | 1,453 | 93 | 340 | 18,261 | 68 | 4,788 | 191 | 35,308 |
| 1981 | 671 | 214 | 8,200 | 1,466 | 87 | 373 | 18,333 | 151 | 4,023 | 70 | 33,588 |
| 1980 | 719 | 213 | 9,149 | 1,588 | 62 | 389 | 19,100 | 130 | 4,499 | 228 | 36,076 |
| Year | Asphalt and Road Oil | Aviation Gasoline | Distillate Fuel Oil | Jet Fuel | Kerosene | Lubricants | Motor Gasoline | Other Petro– leum | Propane | Residual Fuel | Total |
|---|---|---|---|---|---|---|---|---|---|---|---|
| 1979 | 817 | 181 | 12,862 | 1,900 | 57 | 437 | 20,478 | 133 | 4,682 | 707 | 42,254 |
| 1978 | 1,606 | 207 | 12,630 | 1,989 | 456 | 418 | 22,075 | 146 | 5,469 | 1,266 | 46,260 |
| 1977 | 1,098 | 183 | 10,916 | 1,771 | 559 | 389 | 21,810 | 147 | 5,922 | 1,088 | 43,882 |
| 1976 | 570 | 138 | 10,426 | 1,692 | 635 | 547 | 21,580 | 155 | 6,552 | 1,505 | 43,800 |
| 1975 | 754 | 141 | 8,507 | 1,679 | 554 | 492 | 20,636 | 150 | 5,740 | 1,092 | 39,745 |
| 1974 | 976 | 174 | 8,847 | 1,797 | 623 | 519 | 20,412 | 150 | 5,289 | 1,049 | 39,836 |
| 1973 | 884 | 172 | 9,307 | 1,665 | 782 | 542 | 20,948 | 156 | 5,593 | 670 | 40,719 |
| 1972 | 889 | 89 | 9,097 | 1,721 | 771 | 476 | 20,414 | 145 | 6,006 | 720 | 40,329 |
| 1971 | 1,111 | 197 | 7,613 | 1,812 | 680 | 445 | 19,231 | 137 | 5,468 | 579 | 37,273 |
| 1970 | 1,137 | 199 | 7,449 | 1,783 | 582 | 479 | 18,525 | 102 | 5,616 | 793 | 36,665 |
| 1969 | 741 | 233 | 6,439 | 2,038 | 526 | 470 | 18,082 | 109 | 5,669 | 779 | 35,087 |
| 1968 | 787 | 556 | 6,454 | 2,124 | 638 | 467 | 17,451 | 81 | 4,705 | 643 | 33,907 |
| 1967 | 606 | 333 | 5,172 | 1,849 | 348 | 425 | 16,763 | 54 | 4,262 | 586 | 30,397 |
| 1966 | 714 | 362 | 4,464 | 1,510 | 722 | 442 | 16,412 | 43 | 3,818 | 430 | 28,917 |
| 1965 | 655 | 410 | 3,689 | 1,371 | 790 | 425 | 15,745 | 50 | 3,407 | 332 | 26,875 |
| 1964 | 654 | 443 | 4,659 | 1,530 | 496 | 401 | 15,422 | 45 | 3,255 | 983 | 27,888 |
| 1963 | 843 | 428 | 4,351 | 1,491 | 457 | 382 | 15,893 | 47 | 3,672 | 1,161 | 28,725 |
| 1962 | 705 | 423 | 4,080 | 1,463 | 610 | 382 | 15,486 | 46 | 2,953 | 666 | 26,827 |
| 1961 | 702 | 416 | 4,462 | 1,309 | 622 | 413 | 14,965 | 46 | 2,730 | 496 | 26,176 |
| 1960 | 780 | 371 | 4,151 | 1,202 | 677 | 424 | 14,998 | 47 | 2,650 | 415 | 25,731 |
Sources: State Energy Data Report. Energy Information Administration, Washington, DC. Nebraska Department of Environment and Energy, Lincoln, NE.
Notes: Totals may not equal the sum of the components due to independent rounding.
1 Other petroleum is the subtotal of sixteen (16) petroleum products consumed in the industrial sector.