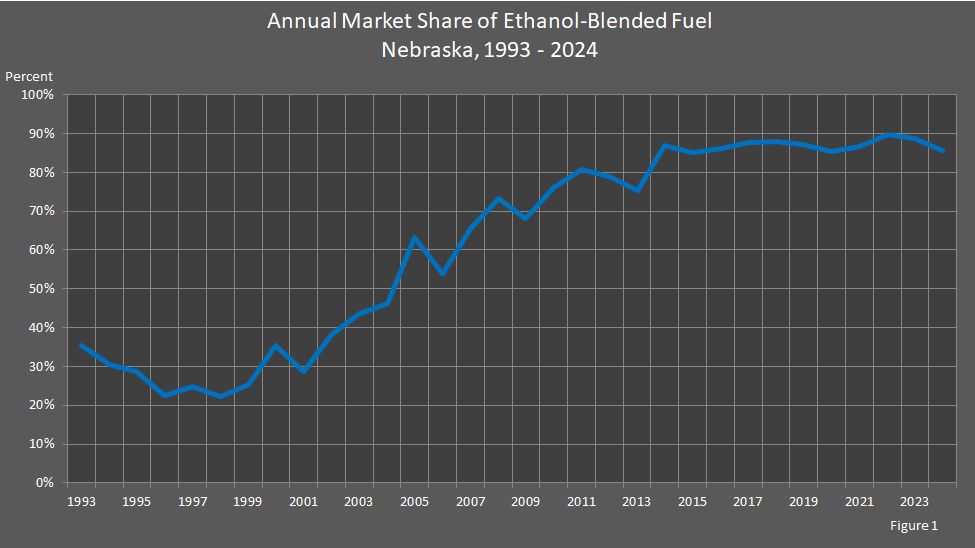
Annual Market Share of Ethanol–Blended Fuel in Nebraska
In Nebraska, most ethanol is sold in a blended fuel—10 percent ethanol with 90 percent gasoline (called E–10) or 85 percent ethanol with 15 percent gasoline (called E85). Of the total gasoline and ethanol–blended fuel sold in the state in 2023, 88.8 percent was an ethanol blend. In Figure 1 and the data table below, the market share of ethanol–blended fuel is shown.
Monthly averages are available. The ethanol section of the Nebraska Energy Office's Energy Statistics has more information.
Market Share of Ethanol–Blended Fuel in Nebraska
1993 – 2023
Year | Ethanol–Blend (Gallons) | Gasoline (Gallons) | Annual Total (Gallons) | Ethanol–Blend Market Share (Percent) |
---|---|---|---|---|
2023 | 816,583,000 | 102,733,157 | 919,316,157 | 88.8% |
2022 | 813,496,964 | 94,125,248 | 907,622,212 | 89.6% |
2021 | 792,358,111 | 121,235,531 | 913,593,642 | 86.7% |
2020 | 723,625,085 | 124,627,390 | 848,252,475 | 85.3% |
2019 | 803,364,733 | 118,846,020 | 922,210,753 | 87.1% |
2018 | 801,220,953 | 111,278,739 | 912,499,692 | 87.8% |
2017 | 796,139,159 | 113,093,475 | 909,232,634 | 87.6% |
2016 | 780,181,844 | 126,958,423 | 907,140,267 | 86.0% |
2015 | 747,720,178 | 131,581,053 | 879,301,231 | 85.0% |
2014 | 764,972,524 | 114,671,991 | 879,644,515 | 87.0% |
2013 | 634,703,226 | 207,468,572 | 842,171,498 | 75.4% |
2012 | 655,352,915 | 176,347,231 | 831,700,146 | 78.8% |
2011 | 662,948,096 | 159,717,125 | 822,665,221 | 80.6% |
2010 | 641,512,693 | 202,737,874 | 844,250,567 | 76.0% |
2009 | 556,777,551 | 261,216,313 | 817,993,864 | 68.1% |
2008 | 603,876,294 | 221,355,779 | 825,232,073 | 73.2% |
2007 | 543,155,418 | 285,501,195 | 828,656,613 | 65.5% |
2006 | 440,640,431 | 375,010,121 | 815,650,552 | 54.0% |
2005 | 519,378,181 | 302,704,444 | 822,082,625 | 63.2% |
2004 | 389,692,366 | 452,232,622 | 841,924,988 | 46.3% |
2003 | 369,010,649 | 478,050,712 | 847,061,361 | 43.6% |
2002 | 325,265,186 | 525,090,650 | 850,355,836 | 38.3% |
2001 | 238,263,262 | 591,695,432 | 829,958,694 | 28.7% |
2000 | 295,453,347 | 541,400,519 | 836,853,866 | 35.3% |
1999 | 213,678,714 | 632,032,642 | 845,711,356 | 25.3% |
1998 | 189,956,805 | 661,061,910 | 851,018,715 | 22.3% |
1997 | 206,250,862 | 629,887,065 | 836,137,927 | 24.7% |
1996 | 183,903,344 | 636,785,443 | 820,688,787 | 22.4% |
1995 | 238,027,521 | 587,503,297 | 825,530,818 | 28.8% |
1994 | 230,802,731 | 525,261,561 | 756,064,292 | 30.5% |
1993 | 278,960,759 | 508,730,756 | 787,691,515 | 35.4% |
Sources: "Monthly Motor–Fuel Consumption." Nebraska Department of Revenue, Motor Fuels Division, Lincoln, NE. Nebraska Department of Environment and Energy, Lincoln, NE.
Notes: The gasoline numbers are net volume numbers which exclude motor fuel for aviation use, non–highway agricultural use, and industrial use. NA indicates data is not available. Numbers in red have been revised.