Electricity Consumption in Nebraska by End–Use Sector

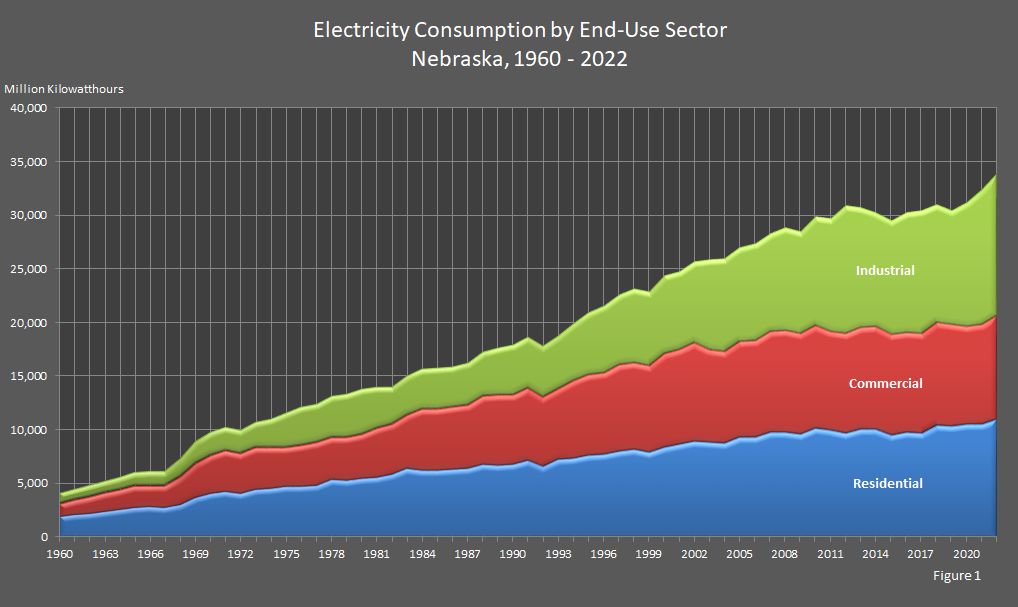
Electricity use in Nebraska rose to 32,341 million kilowatthours in 2021, an increase of 3.8 percent from 31,172 million kilowatthours in 2020. Each of the sectors used relatively one–third of the electricity consumed in Nebraska in 2021. The industrial sector used 38.92 percent, the residential sector used 32.44 percent, and the commercial sector used 28.63 percent.

Electricity Consumption by End-Use Sector Nebraska 1960-2021 Graph


Electricity Consumption by End–Use Sector Nebraska, 2010 – 2021

(Million Kilowatthours)

YearEnd–Use SectorsTotal
CommercialIndustrialResidential
20219,26012,58810,49232,341
20209,09011,56610,51531,172
20199,45710,61910,30830,383
20189,55310,97410,41230,939
20179,29311,3989,66830,359
20169,30711,1549,73830,199
20159,30810,6559,53229,495
20149,52610,66810,02830,222
20139,38711,25110,06230,701
20129,23311,9159,68030,828
20119,13910,5909,94729,676
20109,53210,21010,10729,849


Electricity Consumption by End–Use Sector Nebraska, 1990 – 2009

(Million Kilowatthours)

YearEnd–Use SectorsTotal
CommercialIndustrialResidential
20099,3149,5119,62728,821
20089,4419,6249,75628,811
20079,3969,1049,74828,248
20069,0068,9779,29427,276
20058,8488,8199,30926,976
20048,5018,6188,75725,876
20038,5838,4218,85225,857
20029,1427,5638,95625,661
20018,7577,3288,63824,723
20008,7277,2768,34624,349
19997,9976,8837,92922,810
19988,0696,9168,16023,145
19978,0146,5807,98922,582
19967,5636,1937,74121,497
19957,4945,8027,59720,892
19947,1495,3457,37919,873
19936,5604,9637,22618,749
19926,4704,7526,56117,784
19916,7774,6907,13818,605
19906,4514,6186,80017,868


Electricity Consumption by End–Use Sector Nebraska, 1960 – 1989

(Million Kilowatthours)

YearEnd–Use SectorsTotal
CommercialIndustrialResidential
19896,4734,3706,72317,567
19886,3424,1046,81317,259
19875,9563,8516,37816,185
19865,7983,7576,32515,880
19855,7143,7946,19515,702
19845,6433,7256,26815,636
19834,8863,6656,43814,989
19824,6653,4625,84513,972
19814,5243,8815,60114,006
19804,0684,1555,52113,744
19794,0144,0795,26313,356
19783,9643,7845,34713,095
19773,9573,5994,85912,414
19763,8173,5424,72212,081
19753,6603,2004,69311,553
19743,8332,6064,51210,951
19733,9572,3104,43610,703
19723,7462,1024,0819,929
19713,7702,1934,30810,272
19703,5052,1454,1079,757
19693,2292,0053,6828,915
19682,5491,7433,0997,391
19672,0361,2502,8166,102
19661,9961,2522,8506,098
19652,0251,1822,8166,022
19641,8701,0942,6075,571
19631,7401,0392,4425,221
19621,5899792,2214,790
19611,4099372,0824,427
19601,2698891,9074,065

Sources: State Energy Data Report. Energy Information Administration, Washington, DC. Nebraska Department of Environment and Energy, Lincoln, NE.

Note: Totals may not equal the sum of the components due to independent rounding.